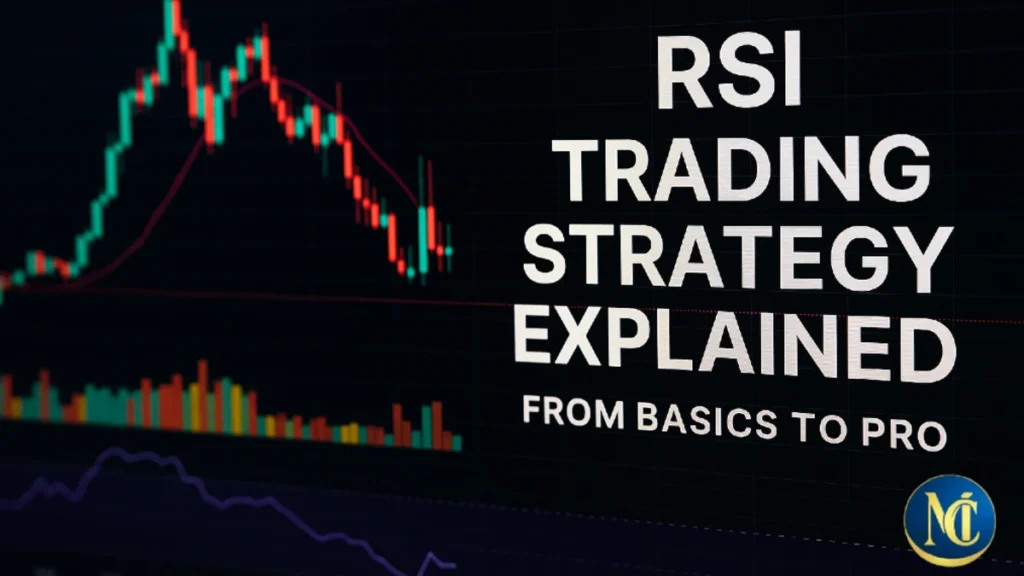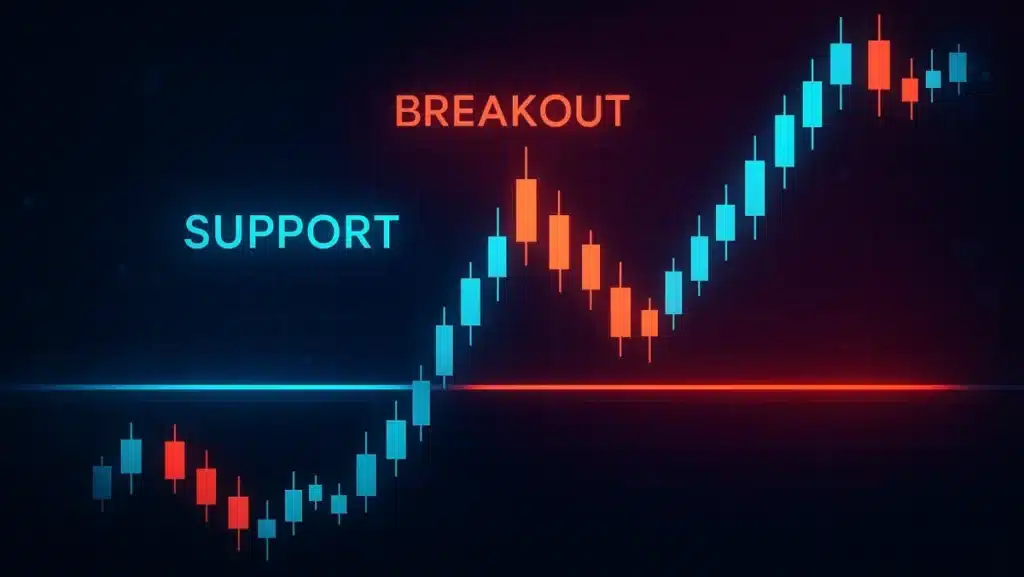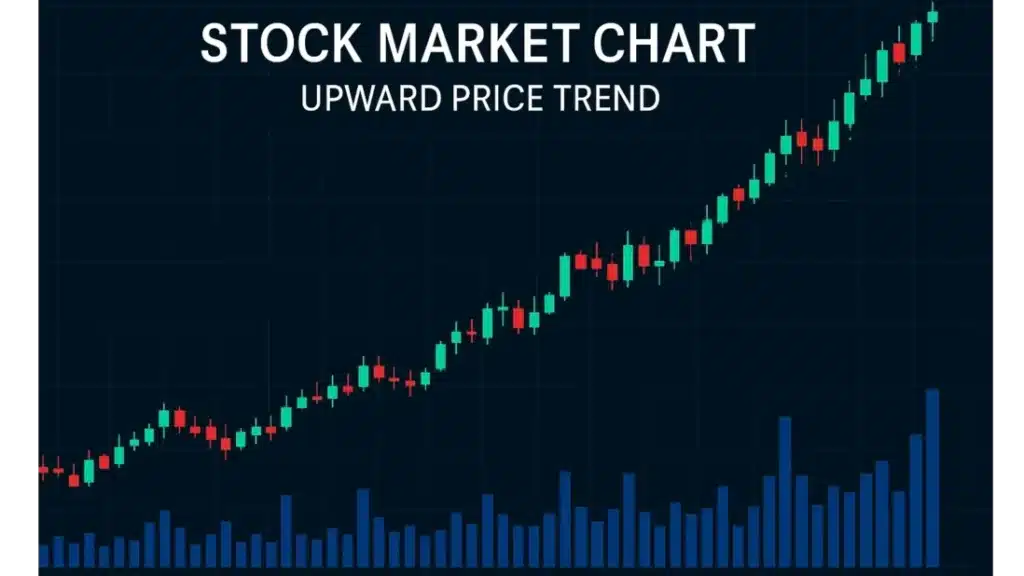
A professional stock chart showing candlesticks, RSI indicator, and modern layout, illustrating the RSI Trading Strategy in action for all levels.

Best RSI Trading Strategy 2026

The Relative Strength Index (RSI) trading strategy is one of the most widely used technical methods in the trading world. No matter if you’re just starting out or have years of trading experience, mastering the RSI 26trading strategy and applying it effectively can provide a valuable advantage in the market. In this article, we’ll break

Best RSI Trading Strategy 2026 Read Post »

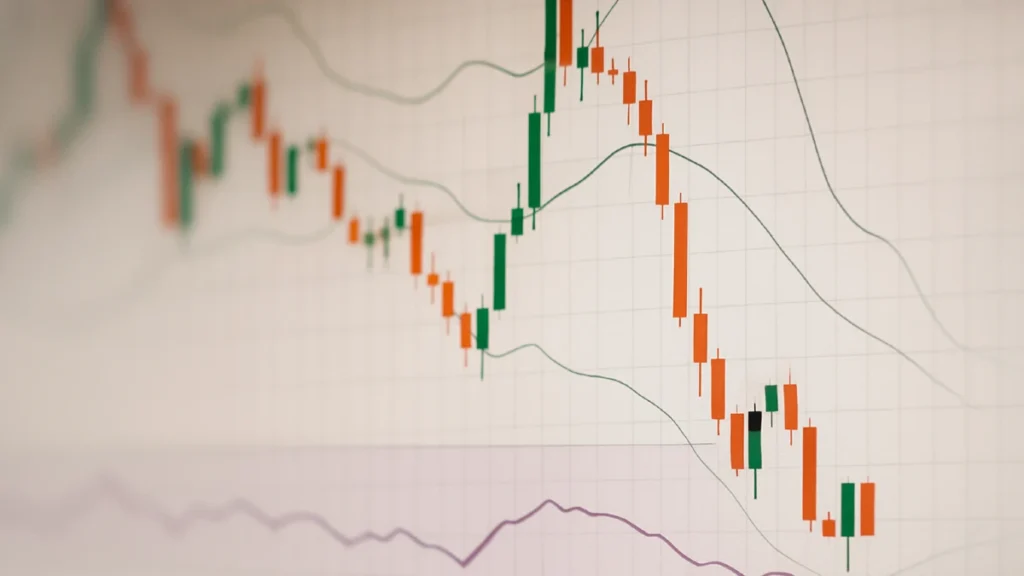
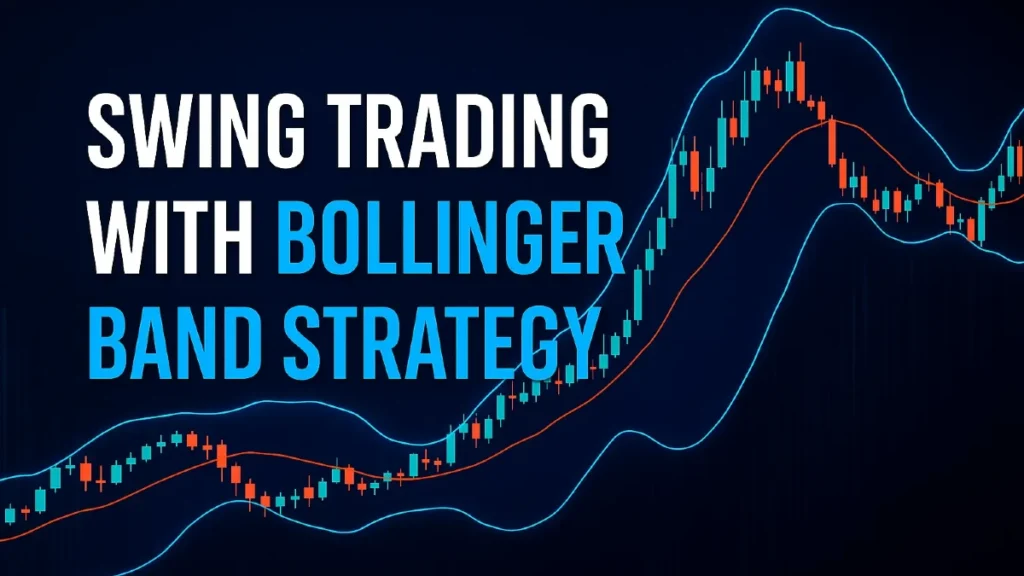
Swing trading strategy using Bollinger Bands on a candlestick chart showing entry, stop-loss, and target zones for better trade planning.

How to Use Bollinger Bands for Swing Trading: Key Methods and Approaches

Swing trading is all about capturing short- to medium-term moves in the stock market. With the rise of technology and access to trading tools, the term ‘swing trading’ is now everywhere especially among retail traders. Naturally, it raises three key questions in every beginner’s mind: What exactly is swing trading? How can one learn it?

How to Use Bollinger Bands for Swing Trading: Key Methods and Approaches Read Post »

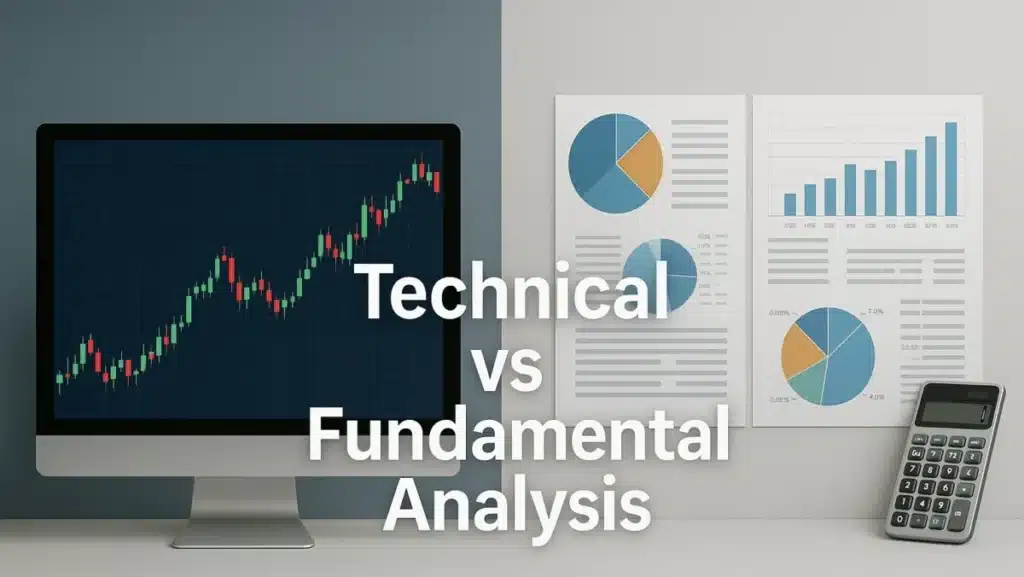
Split-screen image showing Technical Analysis vs Fundamental Analysis with a candlestick chart on one side and a financial report on the other.

Technical Analysis vs Fundamental Analysis: Ultimate Guide

In the world of investing, having a clear method to analyze stocks can make or break your success. Technical analysis vs fundamental analysis are two popular approaches that provide distinct perspectives on evaluating stocks. But which one is right for you? This article explores Technical Analysis vs Fundamental Analysis: Key Differences, helping you understand both

Technical Analysis vs Fundamental Analysis: Ultimate Guide Read Post »

Scroll to Top