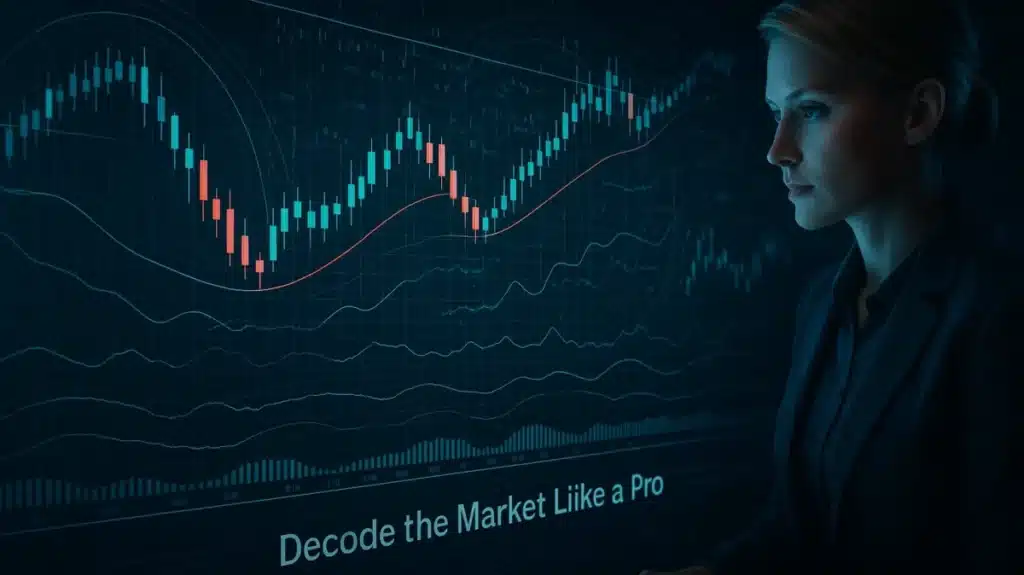
Futuristic trading interface showing candlestick charts, trend lines, and indicators like RSI and MACD, used by a trader for technical analysis.

What is Technical Analysis? A Simple Guide for Traders 2026

What is Technical Analysis, and why do so many smart traders swear by it?While news headlines and quarterly earnings make noise, the real signals often hide within price charts and trading patterns. Technical analysis helps traders decode these signals using historical price action, volume, and chart patterns to anticipate future moves. In this beginner friendly

What is Technical Analysis? A Simple Guide for Traders 2026 Read Post »

Price Action Strategy with candlestick chart background

Price Action Strategy: 10 Key Concepts Every Beginner Should Know

Have you ever looked at a stock chart and wondered why the price suddenly rises, falls sharply, or changes direction? For beginners, understanding stock charts can feel confusing. Candlesticks move constantly, prices cross important levels, and patterns appear that are not always easy to interpret. But learning to read these movements step by step can

Price Action Strategy: 10 Key Concepts Every Beginner Should Know Read Post »

Scroll to Top