
Have you ever looked at a stock chart and noticed a candle with an extremely small body, sometimes looking like a cross or a plus sign? That candle may be a Doji Candlestick Pattern.
For beginners, a Doji can be confusing. Does it mean the stock price will rise? Is a fall coming? Or is the market simply taking a pause?
The key is to understand what the candle actually shows. A Doji forms when the opening and closing prices are equal or very close to each other. It often reflects indecision between buyers and sellers during that period.
However, a Doji does not predict the next price movement on its own. Its meaning depends on the previous trend, the candle’s shape, and what happens afterward. In this guide, you will learn how to identify a Doji, understand its main types, and read it more carefully on a stock chart.
What Is a Doji Candlestick Pattern?
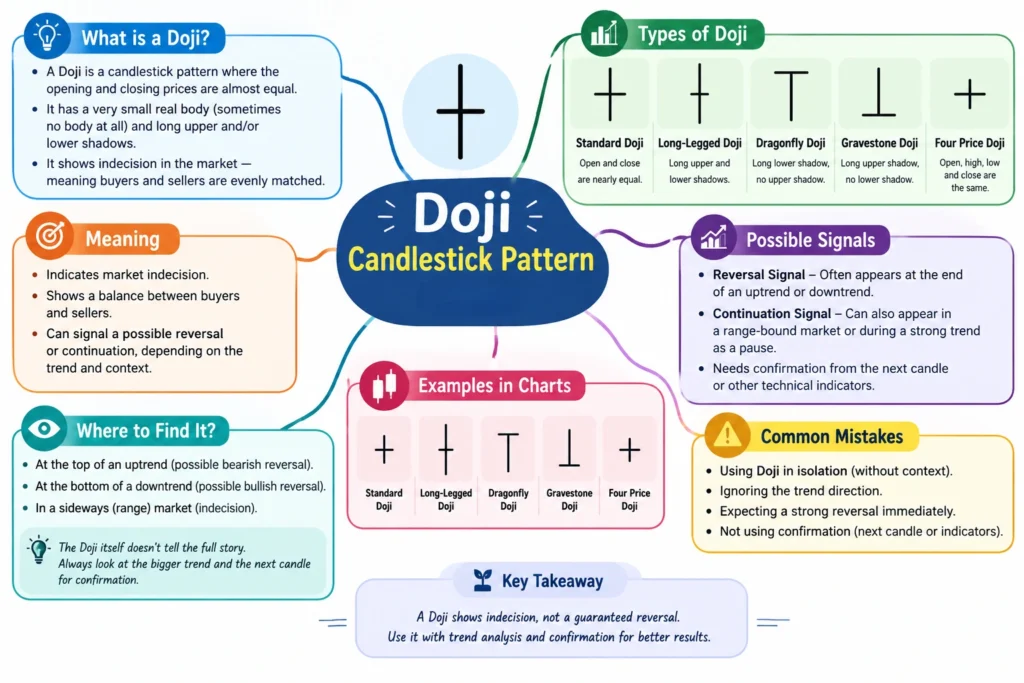
A Doji Candlestick Pattern is formed when an asset’s opening price and closing price are almost the same during a particular time period.
Because these prices are so close, the candle has a very small body or almost no visible body. Its upper and lower shadows, also called wicks, show how far the price moved above and below those levels.
For example, imagine a stock opens at ₹250, rises to ₹258, falls to ₹244, and finally closes at ₹250. The opening and closing prices are identical, even though the price moved significantly during the session.
This creates a Doji-like candle with shadows above and below the opening and closing level. A Doji often represents a temporary balance between buying and selling pressure. Buyers pushed the price higher, sellers pushed it lower, but neither side managed to move the closing price far from where the session began.
How to Identify a Doji Candle
You do not need advanced charting skills to recognise a Doji. Start by checking these features:
- Very small body: The opening and closing prices are equal or nearly equal.
- Upper shadow: It shows the highest price reached during the period.
- Lower shadow: It shows the lowest price reached during the period.
- Overall shape: Depending on its shadows, the candle may look like a cross, a plus sign, a T, or an inverted T.
Not every Doji looks exactly the same. Some have short shadows, while others have long shadows on one or both sides.
There is also no single body-size rule used by every charting method to classify a Doji. The main feature is the very small difference between the opening and closing prices relative to the candle’s overall range.
What Does a Doji Candlestick Mean?
A Doji usually indicates indecision during the time represented by that candle. But the interpretation can change depending on where it appears.
1. Doji after an uptrend
Imagine a stock has been rising for several sessions. Then a Doji appears.
The candle suggests that, during that session, buyers were unable to push the closing price much higher than the opening price. This may indicate a pause in upward momentum.
It does not automatically mean the price will fall. The next candles and the surrounding price action matter.
2. Doji after a downtrend
Now imagine a stock has been falling for several sessions before a Doji appears.
The candle shows that selling pressure did not produce a large difference between the opening and closing prices during that period. It may indicate hesitation among sellers or a possible change in momentum.
However, the price may continue falling. A Doji alone does not confirm a bullish reversal.
3. Doji during sideways movement
If a stock is already moving within a narrow range, a Doji may simply reflect the existing lack of direction. In this situation, it may provide little new information. That is why understanding the broader trend is important before interpreting a candle.
You may also Like : Price Action Strategy: 10 Key Concepts Every Beginner Should Know
What Are the Different Types of Doji Candlestick Patterns?
There are four commonly discussed Doji types. They share the same basic feature a tiny body but their shadows differ.
1. Standard Doji
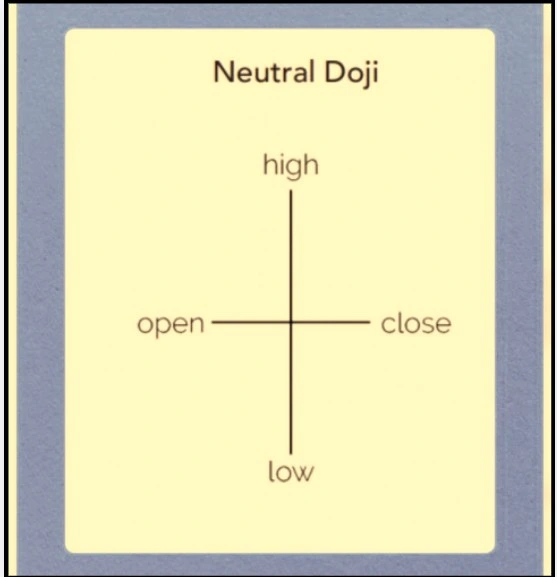
A Standard Doji usually has a tiny body with upper and lower shadows. The shadows may be similar in length, although they do not have to be exactly equal. It indicates indecision during the session. Its significance depends on the trend and price level where it forms.
2. Long-Legged Doji
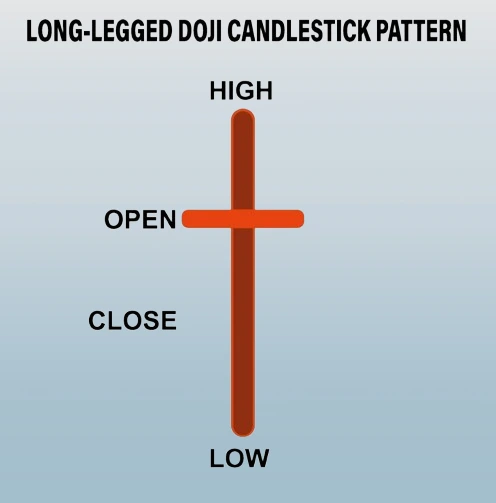
This Doji has long upper and lower shadows with a very small body. The price moved considerably in both directions but finished near its opening level.
It shows greater price movement and uncertainty during the session, but it does not reveal which direction the market will take next.
3. Dragonfly Doji
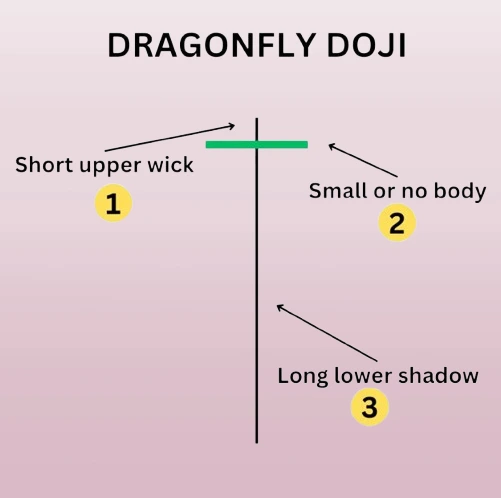
A Dragonfly Doji Candlestick has a long lower shadow and little or no upper shadow. The opening, closing, and high prices are at or near the same level.
It shows that the price fell during the session but recovered toward the opening level. After a decline, it may suggest rejection of lower prices, but confirmation is still needed.
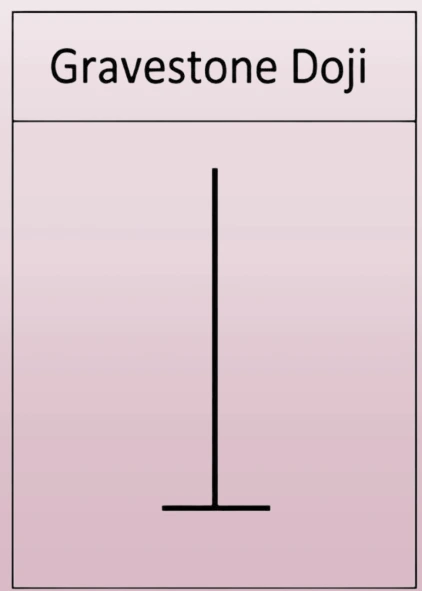
4. Gravestone Doji
A Gravestone Doji has a long upper shadow and little or no lower shadow. The opening, closing, and low prices are at or near the same level.
It shows that the price rose during the session but fell back toward the opening level. After an uptrend, it may indicate rejection of higher prices, although it is not a guaranteed bearish signal.
A fifth, much rarer form is the Four Price Doji, where the opening, high, low, and closing prices are all identical. It appears as a horizontal line and may occur in very inactive or illiquid trading conditions.
Doji Candlestick Pattern Examples
The easiest way to understand a Doji is to look at hypothetical price examples.
Example 1: Doji after a price rise
Suppose a stock moves from ₹200 to ₹220 over several sessions. On the next day, it opens at ₹220, reaches ₹226, falls to ₹215, and closes at ₹220.
The opening and closing prices are the same, so the candle forms a Doji.
What can you learn from this example?
- The price moved both above and below the opening level.
- Neither side managed to move the closing price far from the opening price.
- After the earlier rise, the candle may indicate hesitation in the market.
If subsequent candles move lower, that may provide evidence of weakening upward momentum. If they move higher, the uptrend may continue. The Doji alone cannot settle the question.
Example 2: Doji after a price fall
Suppose a stock falls from ₹350 to ₹320 over several sessions. It then opens at ₹320, drops to ₹312, rises to ₹327, and closes at ₹321.
The opening and closing prices are close, creating a Doji.
This candle shows that sellers pushed the price lower, but buyers helped recover much of the decline before the session ended.
It may suggest that selling pressure is slowing. However, the stock could still fall further if sellers regain control. Important: These prices are hypothetical examples for learning purposes, not real market data or trading recommendations.
How to Read a Doji on a Stock Chart
When you spot a Doji, avoid judging it by its shape alone. Use the following process to understand its context.
- Check the previous trend. Was the price rising, falling, or moving sideways before the Doji appeared?
- Look at the price level. Is the candle forming near a previously observed support or resistance area?
- Observe the shadows. A long lower shadow tells a different story from a long upper shadow.
- Study the following candle. Does the next candle move decisively in either direction, or does indecision continue?
- Consider the wider chart. One candle is only a small part of the overall price movement.
For example, a Doji after a strong rise near a resistance area may deserve attention. But without further evidence, it should not be treated as proof that the price is about to fall. Similarly, a Doji after a decline near support may suggest hesitation among sellers, but it does not confirm that the price will rise.
You may also Like : Hammer Candlestick Pattern: A Beginner’s Guide with Examples
Doji vs Hammer Candlestick Pattern
Beginners sometimes confuse a Dragonfly Doji with a Hammer because both can have a long lower shadow. However, their body shapes differ.
| Feature | Doji | Hammer |
| Body | Extremely small or nearly invisible | Small but visible |
| Lower shadow | Depends on the Doji type | Usually long |
| Upper shadow | Varies by type | Usually small |
| Main interpretation | Indecision | Possible bullish reversal after a decline |
| Confirmation | Context and following price action | Context and following price action |
A Dragonfly Doji has its opening and closing prices near the top of the candle’s range, creating a T-like shape. A Hammer has a small visible body near the top and a long lower shadow.
Both patterns require context. Neither guarantees that the price will reverse.
Common Mistakes Beginners Should Avoid
Learning the shape of a Doji is only the first step. These mistakes can lead to incorrect interpretations.
1. Assuming every Doji means a reversal
A Doji shows indecision, not a definite change in direction. A price trend can continue after one appears.
2. Ignoring the previous trend
A Doji after a strong move may have a different meaning from one that forms during sideways movement. Always check what happened before it.
3. Ignoring the next candle
The candle that follows may provide additional information about whether buyers or sellers are gaining control. It is important to distinguish a possible signal from a confirmed change in price behaviour.
4. Focusing only on candle colour
A Doji may appear green or red on a chart depending on the small difference between its opening and closing prices. The shape, shadows, trend, and context are generally more informative than its colour alone.
5. Treating one pattern as enough information
A single candle provides only a limited view of market behaviour. Consider the broader chart and other relevant information rather than relying on a Doji in isolation.
Frequently Asked Questions About the Doji Candlestick Pattern
Conclusion
The Doji Candlestick Pattern is a useful concept for understanding how buyers and sellers interact during a trading session. Its tiny body shows that the opening and closing prices ended close together, while its shadows reveal how far the price moved in between.
The Standard, Long-Legged, Dragonfly, and Gravestone Doji each have distinct shapes. However, their meaning depends on the wider market context. A Doji may appear before a reversal, during a pause, or while an existing trend continues.
The most important lesson is simple: learn to read the candle, understand where it appears, and avoid assuming that one pattern predicts what comes next.
Disclaimer: The information provided in this article is for educational purposes only and should not be considered as financial advice. Always conduct your own research or consult with a qualified financial advisor before making any investment decisions.