In the world of technical analysis, traders often rely on individual indicators like Bollinger Bands or the RSI Strategy to guide their entries and exits. However, using a single indicator in isolation can lead to false signals and poor decisions. To build a more reliable approach, it’s essential to understand how different tools can complement each other.
This guide will help you learn how to combine Bollinger Bands and RSI Strategy to identify better trade setups. This is not a predictive tool or a guaranteed strategy, but an educational framework designed to enhance your understanding of price behavior and market momentum.
Bollinger Band and RSI RSI Strategy
What Are Bollinger Bands?
Created by John Bollinger, Bollinger Bands are a widely used technical tool designed to measure market volatility. They consist of:
- Middle Band: A 20-period simple moving average (SMA)
- Upper Band: SMA + 2 standard deviations
- Lower Band: SMA − 2 standard deviations
What They Indicate
The width of Bollinger Bands changes with market volatility, widening during high volatility and narrowing when the market is calm. When the price reaches the lower Bollinger Band, it can be a signal that the asset is potentially oversold. A price touching the lower Bollinger Band can indicate that the asset is potentially in an oversold condition. However, these signals are not absolute and often require confirmation from another indicator like RSI.
What Is RSI?
The Relative Strength Index, or RSI, is a momentum-based indicator created by J. Welles Wilder to measure the speed and change of price movements. It moves between 0 and 100 and is typically used to identify overbought and oversold conditions.
- Above 70: Possibly overbought
- Below 30: Possibly oversold
- Divergence: When price makes a new high/low but RSI doesn’t, it may signal a potential reversal
RSI gauges how strong and fast price changes are, helping traders determine if a recent price swing might have been overdone.
Why Combine RSI with Bollinger Bands?
While Bollinger Bands focus on price volatility, RSI focuses on momentum. By combining them, you can:
- Filter out weak or false signals
- Identify stronger trade setups with both price and momentum in agreement
- Reduce reliance on lagging indicators alone
Using Bollinger Bands alongside RSI can help filter out false signals and improve the accuracy of your trading decisions. If you use this strategy correctly, you can take successful trades. To master it, practice daily — analyze at least 100 charts every day and train your eyes to recognize patterns. This will help you spot quality trade setups more easily.
You may also Like : Swing Trading with Bollinger Bands Strategy Explained
Bollinger Band and RSI Combined Strategy
If you’re tired of falling for false signals or entering trades too early, this strategy might change your trading thought.
By combining Bollinger Bands with RSI (Relative Strength Index) across multiple timeframes Monthly, Weekly, and Daily you can find high-probability entries that align with strong trends. It’s a technique I’ve used over and over again, and it works because it focuses on momentum + structure not just signals. Let me walk you through it step by step, along with a hidden secret I’ve learned from studying thousands of charts.
Step 1: Start with the Monthly Chart
Your first task is to find a stock showing a Bollinger Band Blast on the Monthly timeframe.
A Bollinger Band Blast occurs when the price breaks out of a tight range and moves strongly beyond the upper Bollinger Band. This breakout indicates strength but strength needs confirmation.
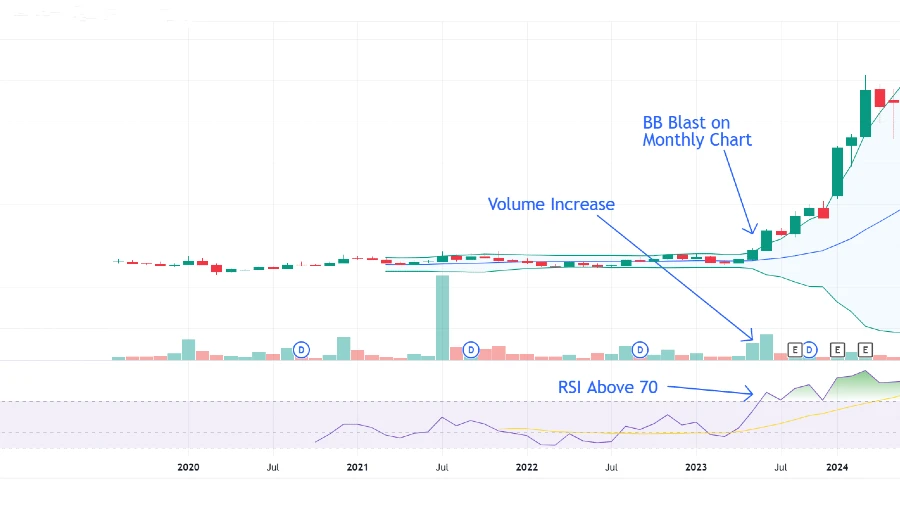
That’s where RSI comes in.
- Check the Monthly RSI
It should be above 70.
Why? Because RSI > 70 means the stock is trending with strong momentum. It’s not just a one-candle wonder it’s backed by buyers over time.
Don’t just rely on price breakouts alone. RSI confirmation filters out the noise.
As you can see in the chart above, Bollinger Band blasts on the monthly chart are confirmed by the RSI reaching 70, along with an increase in volume indicating strong buyer activity.
Hidden Tip: Whenever the RSI on the monthly timeframe starts moving above 70, you’ll often see the price doubling from that level (with a few exceptions). To take full advantage of this, you need to practice and backtest thoroughly so that you can identify such chart
Step 2: Move to the Weekly Chart
Once the Monthly chart looks bullish, switch to the Weekly timeframe.
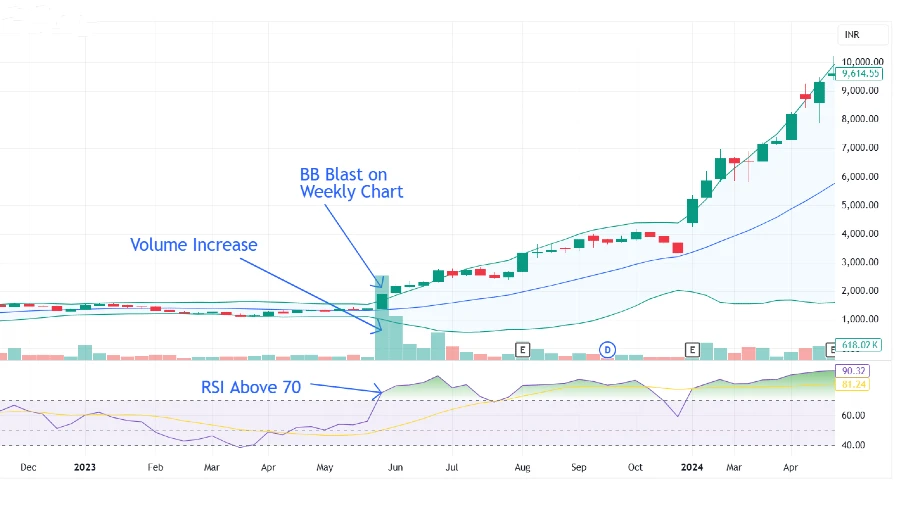
Now you’re looking for a similar setup:
- Another Bollinger Band Blast (or strong breakout)
- Weekly RSI moving upward, ideally near or above 60–70
If the stock is breaking out on both the Monthly and Weekly timeframes, it means the trend is supported across longer periods a very strong bullish signal.
Monthly breakout + Weekly breakout = multi-timeframe alignment (and high probability trade)
Step 3: Zoom Into the Daily Chart
Now it’s time to find your entry and this is where you minimize risk.
Go to the Daily chart and wait for a pullback to the middle Bollinger Band, which is the 20-period Simple Moving Average (SMA).
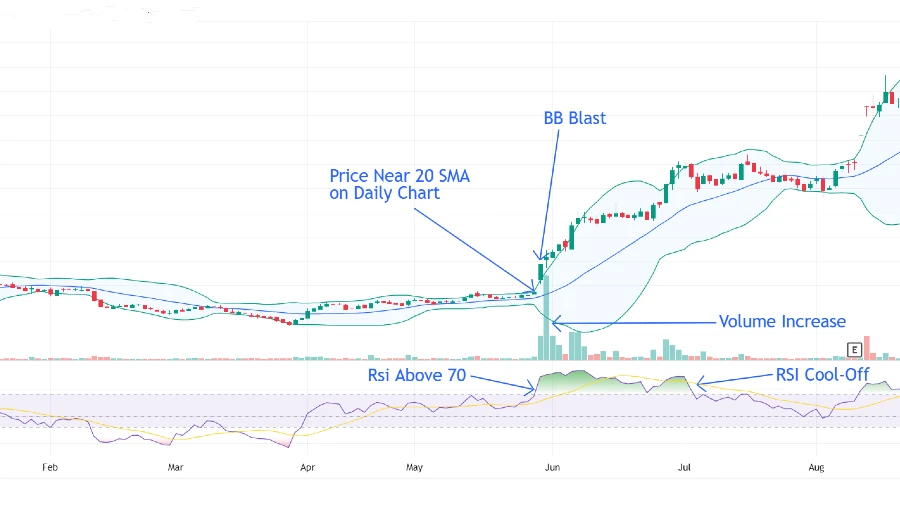
Once the price touches or gets close to this line, look for a bullish candlestick pattern, such as:
- Bullish engulfing
- Hammer
- Strong green candle with high volume
If you see this around the 20 SMA after a multi-timeframe confirmation, it’s a great spot to consider entering.
You’re not chasing the breakout you’re joining the trend at a pullback, when the risk is lowest and the reward potential is high.
You may also Like : Stock Market Investing: A Beginner’s Guide to Financial Freedom 2025
Hidden Secret: Why Daily Charts Must Follow Higher Timeframes
Here’s something I’ve discovered after reviewing thousands of charts:
If the Monthly and Weekly charts are strong, the Daily chart cannot stay weak for long.
Even if the Daily chart shows short-term weakness like a dip or sideways move it usually aligns with the higher timeframes eventually. That’s just how market structure works.
So, if you ever see the Daily chart lagging behind while Monthly and Weekly remain strong, be patient. That lag often sets up the perfect entry.
Key Warning: Watch Daily RSI Above 70
One important risk-management tip:
When the Daily RSI crosses 70, be cautious.
It often means:
- The stock is in short-term overbought territory
- A cool-off or consolidation phase may follow
This doesn’t mean the trend is over, but it’s not the best time to enter a new position. Instead, it’s a time to:
- Take partial profits
- Tighten your stop-loss
- Wait for the next pullback to re-enter
Let RSI guide your timing, not just your direction.
Practice Is the Real Secret
This strategy is simple, but like all trading techniques, it takes practice and screen time to master.
Here’s what I recommend:
- Study 100 charts every day
Look for this setup across different sectors and timeframes.
Over time, your eyes will naturally begin to spot it. - Be patient with your entries
Let the price come to the 20 SMA. Wait for confirmation.
Trust the higher timeframes
They move slower but hold the most power.
Conclusion
The combination of Bollinger Bands and RSI across multiple timeframes helps filter out false signals and identify high-probability trade setups. By aligning the Monthly, Weekly, and Daily charts, you gain a clearer view of market momentum and structure.
This isn’t just a strategy it’s a framework for disciplined trading. With regular practice and chart analysis, your ability to spot quality setups will improve significantly. Keep it simple, follow the process, and let the trend work in your favor.
Frequently Asked Questions (FAQs)
Disclaimer: The information provided in this article is for educational purposes only and should not be considered as financial advice. Always conduct your own research or consult with a qualified financial advisor before making any investment decisions.