What is Technical Analysis, and why do so many smart traders swear by it?
While news headlines and quarterly earnings make noise, the real signals often hide within price charts and trading patterns. Technical analysis helps traders decode these signals—using historical price action, volume, and chart patterns to anticipate future moves.
In this beginner-friendly guide, we’ll explain what technical analysis means, how it works, and what tools you need to start reading the market like a pro. Whether you’re just starting your trading journey or looking to sharpen your chart-reading skills, this post is your roadmap to mastering technical analysis from the ground up.
- What is Technical Analysis?
- Why Do Traders Use Technical Analysis?
- The Three Core Beliefs of Technical Analysis
- Understanding the Tools of Technical Analysis
- Choosing the Right Timeframe
- How to Read a Basic Candlestick Chart
- Limitations of Technical Analysis
- Top Tips for Beginners in Technical Analysis
- Combining Technical and Fundamental Analysis
- Common Myths About Technical Analysis
- Conclusion: Start Small, Learn Continuously
What is Technical Analysis?
Technical analysis involves studying past price trends, trading volumes, and chart formations to anticipate how a security’s price might move. While fundamental analysis looks at a company’s financial health, market analysis guides traders by examining price trends and market sentiment. It’s widely used in stock trading, forex, and crypto markets to pinpoint entry and exit opportunities more accurately.
Why Do Traders Use Technical Analysis?
Here are some of the key reasons why traders rely on market analysis:
- To identify trends early (bullish or bearish)
- To time market entries and exits with better precision
- To control risk by using support and resistance zones along with stop-loss measures.
- To remove emotional bias by following rule-based systems
Regardless of whether you trade daily or invest for the long haul, technical analysis adds clarity and consistency to how you make decisions.
The Three Core Beliefs of Technical Analysis
Technical analysis is built on three foundational principles:
1. Market Discounts Everything
Every known factor—economic, political, social—is already priced into the market. Price is the ultimate truth.
2. Prices Move in Trends
Markets don’t move randomly. They trend—upwards, downwards, or sideways. Recognizing these trends can improve your timing.
3. History Repeats Itself
Human behavior is consistent. Patterns that worked in the past are likely to work again because market psychology doesn’t change much over time.
Understanding the Tools of Technical Analysis
1. Types of Technical Analysis Charts
Charts are the foundation of technical analysis. There are several types of technical analysis charts that help traders understand market behavior more clearly
The most widely used types of charts in technical analysis include:

- Line Chart – Simplest form, connecting closing prices
- Bar Chart – Displays the opening, highest, lowest, and closing prices for a specific period
- Candlestick Chart – Visual and easy to interpret, shows OHLC with colored bodies
2. Indicators & Oscillators
These are mathematical formulas plotted on charts to provide signals:
- Moving Averages (SMA/EMA) – Smooths out price action
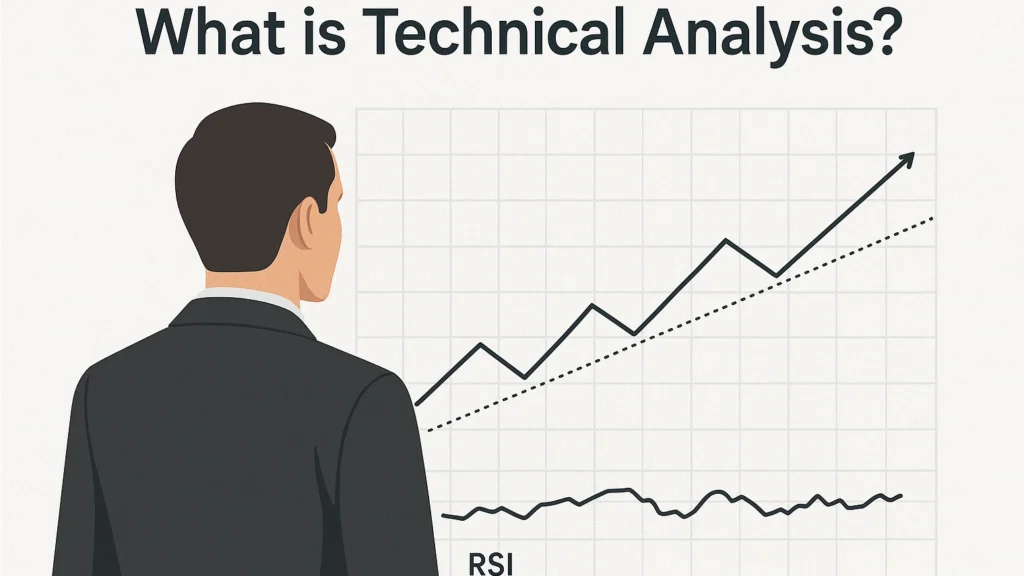
- RSI (Relative Strength Index) – Indicates whether an asset is potentially overbought or oversold based on recent price momentum.
- MACD (Moving Average Convergence Divergence) – Helps identify the strength and direction of a trend by tracking momentum shifts.
- Bollinger Bands – Shows volatility and price extremes
3. Chart Patterns
Chart patterns often hint at future price action:
- Head and Shoulders – Signals potential reversal
- Double Top/Bottom – Indicates trend reversal
- Triangles & Flags – Common continuation patterns
4. Volume Analysis
Volume confirms price trends. Rising prices with increasing volume suggest strong bullish momentum. Declining prices with high volume often indicate panic selling.
Choosing the Right Timeframe
Timeframes are crucial. Depending on your trading style:
- Intraday traders prefer 30-minute or 1-hourly charts
- Swing traders use hourly or daily charts
- Investors often rely on weekly or monthly charts
Each timeframe gives a different perspective. Always align your analysis with your trading goals.
How to Read a Basic Candlestick Chart
Understanding candlesticks is a vital step. Each candle shows four price points:

- Open – Price at the start of the session
- High – Highest price traded
- Low – Lowest price traded
- Close – Final price of the session
Bullish candles are usually green or white (close > open), and bearish candles are red or black (open > close). Recognizing simple patterns like Doji, Hammer, or Engulfing candles can give valuable insights.
Limitations of Technical Analysis
While powerful, technical analysis is not foolproof. Here’s what you should keep in mind:
- False signals are common, especially in volatile markets
- News and events can override patterns or indicators
- Interpretation varies – the same chart can lead to different conclusions depending on the trader analyzing it.
- It’s a probability game, not a certainty
Why risk management, position sizing, and stop-loss strategies are vital.
In recent years, the rise of artificial intelligence and machine learning has revolutionized technical analysis. Many hedge funds and professional traders now use AI-driven algorithms to scan markets for profitable opportunities in real-time.
Top Tips for Beginners in Technical Analysis
- Start simple – Learn one chart type and one or two indicators
- Avoid cluttering your chart – Less is often more
- Backtest your strategy before using real money
- Practice with a demo account
- Keep a trading journal – Record what works and what doesn’t
- Never trade based on one indicator alone – Look for confluence
One common mistake beginners make is relying too heavily on a single indicator without considering other factors. For instance, using only the Relative Strength Index (RSI) to make trade decisions can be misleading if not analyzed with the price action or volume patterns.
Emotional control is often the hardest part of trading. Even when the charts point to a promising opportunity, fear and greed can cloud judgment. Successful traders learn to control their emotions, stick to their strategy, and avoid overtrading based on impulse.
Combining Technical and Fundamental Analysis
You don’t have to pick sides. Many smart investors use both:
- Use fundamentals to pick strong companies
- Use technicals to time your entry and exit
For example, if a stock has strong earnings but is technically in a downtrend, it might be wise to wait until the trend reverses before buying.
Common Myths About Technical Analysis
- “It guarantees profits” – No strategy guarantees anything.
- “It’s only for day traders” – Even long-term investors use charts.
- “It’s outdated” – Market psychology never goes out of style.
Conclusion: Start Small, Learn Continuously
Technical analysis can be a powerful ally in your investing toolkit. But like any skill, it takes time, study, and practice. Begin with basic chart reading, explore indicators slowly, and stay focused on the big picture. Markets are uncertain, but with the right mindset and tools, you can navigate them with greater confidence.