Swing trading is all about capturing short- to medium-term moves in the stock market. With the rise of technology and access to trading tools, the term ‘swing trading’ is now everywhere—especially among retail traders. Naturally, it raises three key questions in every beginner’s mind: What exactly is swing trading? How can one learn it? And most importantly, does it really work?
In this article, we’ll answer all three questions and walk you through a powerful yet simple swing trading strategy using Bollinger Bands. If you’re willing to put in the effort, backtest the setup, and follow the rules, success is possible. I can show you the path, but walking it is up to you. I can point you in the right direction, but it’s your steps that will get you there.
Swing Trading
- What is Swing Trading?
- Understanding Bollinger Bands
- Why Use Bollinger Bands for Swing Trading?
- The Reality of Trading
- The Bollinger Band Swing Trading Strategy (Step-by-Step)
- Manage the Trade Professionally
- Example Trade Setup Using Bollinger Bands
- Risk Management Tips
- Final Word on Risk
- Common Mistakes to Avoid
- Backtesting and Practice
- Conclusion: Simplicity, Discipline, and Patience Win the Game
What is Swing Trading?
Swing trading is a style of trading that aims to capture price movements that unfold over a few days to a few weeks. Unlike day trading, which involves buying and selling within the same day, or long-term investing that spans months or years, swing trading sits right in the middle. It’s perfect for traders who want to stay active in the market without being glued to a screen all day.
In simple terms, swing traders look for “swings” in the market — short-term upward or downward moves — and try to enter early in the move, then exit before it reverses. These swings often happen in reaction to earnings, news events, market sentiment shifts, or technical patterns.
One of the reasons swing trading appeals to retail traders is because it fits well into a part-time schedule. You can analyze charts in the evening, place your trades with proper planning, and monitor them during the day with alerts. It’s flexible, practical, and when done right, quite effective.
From my experience, swing trading works best when backed by a structured strategy and a disciplined mindset. Random entries don’t work — you need a reason to enter, a plan for managing risk, and clarity on when to exit.
Understanding Bollinger Bands
To trade effectively, you need tools that give your insight into price behavior — not just pretty lines on a chart. One such tool that has stood the test of time is the Bollinger Bands indicator. Created by technical analyst John Bollinger, this indicator helps traders identify volatility, overbought/oversold conditions, and potential breakout opportunities.
Bollinger Bands consist of three lines:
- Middle Band: This is a simple moving average (usually 20-period).
- Upper Band: Set at a point that’s two standard deviations above the middle band.
- Lower Band: It’s placed two standard deviations below the middle band.
Here’s what makes it powerful: the bands expand and contract based on market volatility. Low volatility causes the bands to move closer together. When volatility picks up, the bands widen. This “breathing” action tells you a lot about what the market might be preparing to do.
Traders often use Bollinger Bands to spot:
- Breakouts after a period of consolidation (known as a “Bollinger Squeeze”)
- Reversals when price touches the upper or lower bands and shows signs of exhaustion
- Trend continuations when price rides the band in a strong direction
In swing trading, Bollinger Bands act like dynamic support and resistance levels — giving us clear visual cues for potential entries and exits. But the key is knowing when to trust the signal and when to wait. That is exactly what the next part of the strategy will cover.
Why Use Bollinger Bands for Swing Trading?
Bollinger Bands can be used as a trading tool. Traders and investors can improve their performance by applying Bollinger Bands. They help identify whether accumulation or distribution is happening in the market. However, Bollinger Bands are not 100% perfect on their own. The combination of Bollinger Bands and experience leads to more accurate results
1. They Adapt to Market Conditions
Most indicators are fixed — they don’t adjust based on what the market is doing. Bollinger Bands, on the other hand, expand during high volatility and contract when things get quiet. This flexibility is useful because swing traders need to know when to stay patient and when to prepare for a breakout.
2. They Help Spot Support and Resistance Zones
Think of the Bollinger Bands as moving lines of dynamic support and resistance—the upper band often pushes back when prices come close. If it hits the lower band, it may find support.
3. Benefit of Using Bollinger Bands in an Uptrend
When prices are going up, you’ll see both the top and bottom Bollinger Bands moving higher. In such conditions, whenever the price approaches the middle band (20-SMA), it tends to find support and then moves higher again.
4. They’re Visual and Easy to Understand
Unlike some complex indicators, Bollinger Bands are intuitive. Once you get used to how they move with price, you’ll start spotting potential trades almost at a glance. That’s one reason I keep them on nearly every chart I analyze.
In short, Bollinger Bands don’t predict the future — nothing does. But they help you understand what the market is doing right now, which is all you really need to make smart swing trading decisions.
You may also Like : How Volume Confirms Price Trends in Technical Analysis
The Reality of Trading
Trying to hit the very top or bottom is more luck than skill for most people. Typically, only the 20% at the top and bottom are in their control, while 60% of the market moves are out of their hands. If someone manages to sell at the top or buy at the bottom, it was a gamble that worked out this time. However, there’s no guarantee that the next time it will work the same way.
The Bollinger Band Swing Trading Strategy (Step-by-Step)
Over the years, I’ve tested dozens of setups using Bollinger Bands, and one simple pattern keeps delivering — a breakout from consolidation followed by a momentum moves. Here’s how you can use this approach in your swing trading.
Step 1: Choose the Right Time Frame
For swing trading, the most practical timeframes are the 1-hour, 4-hour, or daily charts. I personally prefer the 4-hour chart for clearer signals with less noise, but if you’re looking for faster setups, the 1-hour chart works too.
Whenever you swing trade, if you’re using the daily chart, also check the weekly and monthly charts to see if those timeframes are strong. If the price is strong on the larger timeframes, the daily chart will likely align with that trend as well
Step 2: Wait for a Bollinger Band Squeeze
Look for periods where the Bollinger Bands narrow and price moves range bound. This “squeeze” signals low volatility. Then, either accumulation or distribution occurs there, and to identify this, we use Bollinger Bands. The bands become narrower in such cases, and the narrower they get, the bigger the breakout will be when it happens. Be patient here. No action is often the best setup.
Step 3: Look for a Breakout Candle
To take a Bollinger Band breakout trade on the daily timeframe, the price must break the high of the range-bound period. If the price breaks through and then sustains above the VWAP on the 1-hour timeframe, a trade can be considered.
Step 4: Confirm with Price Action
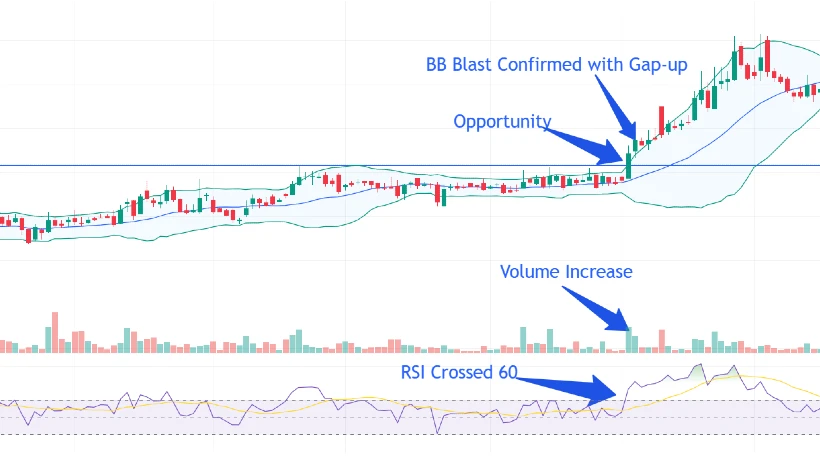
A Bollinger Band breakout is confirmed when the price gaps up the next day and sustain. There’s also a hidden truth that can help confirm this trade further
- Volume spike on breakout candle and follow-up
- RSI crossing 60 in the direction of the trade
RSI and the volume indicator, which can be easily added to the chart, can be used to make this setup more reliable. One thing to always remember is that no setup is 100% reliable. It will only work for you if you backtest it with practice and train your eyes to identify the trend for this setup.
Step 5: Set a Proper Stop-Loss
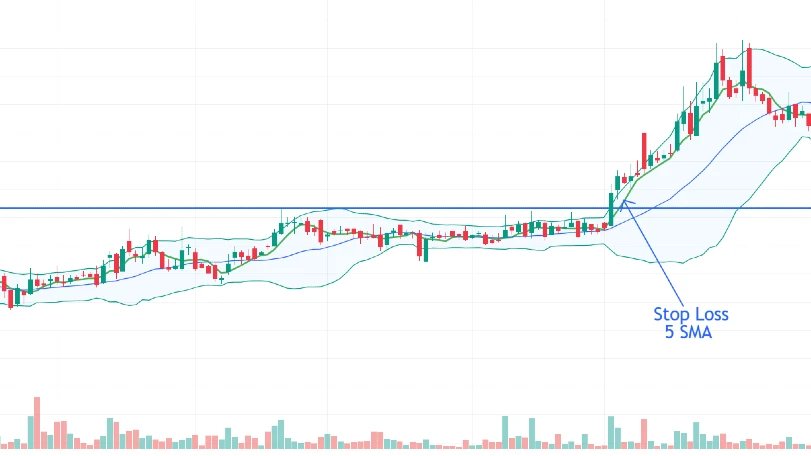
Best stop loss: If the candle closes below the 20 SMA on a daily chart, then exit. You can also use the 5 SMA to set your stop loss. This could work because if we are correct, the price won’t break below it either.
This keeps your risk contained if the breakout fails — which sometimes it will. That’s part of the game.
Step 6: Set a Profit Target
Never define a target in any trade. If the trade you took is correct, then keep a 5 SMA stop loss. Always consider the 2nd candle confirmation. If it looks like the 2nd candle will close below the 5 SMA, exit the trade. And if you’re right, then ride the profit. This is the best way to trade.
In any trade, if you fix a target, you cannot ride the profit.”
This essentially means that if you set a fixed target for your trade, you may miss out on potential gains because you’re not allowing the trade to fully develop or reach its maximum potential.
Manage the Trade Professionally
Always focus on the stop loss, not the profit. Keep your emotions under control and trust yourself. Most people make the mistake of letting their stop loss run and exiting the trade as soon as they see a small profit. This usually happens because emotions take over.
This strategy won’t win every time — no strategy does. But with consistency, risk control, emotion control and proper backtesting, it puts the odds in your favor.
Every day, study 100 charts using the same setup and practice consistently. Practice makes perfect. If you look at multiple charts daily, over time your eyes will naturally start recognizing winning setups.
You may also Like : Top 10 Chart Patterns Every Trader Should Know
Example Trade Setup Using Bollinger Bands
Let’s walk through a sample trade using the exact steps from the strategy. This is a hypothetical setup, but based on real market behavior I’ve seen repeatedly.
🕒 Chart Timeframe: Daily
📈 Stock: Redington Ltd
🔧 Indicator: Bollinger Bands (20, 2)
Step 1: Spotting the Squeeze
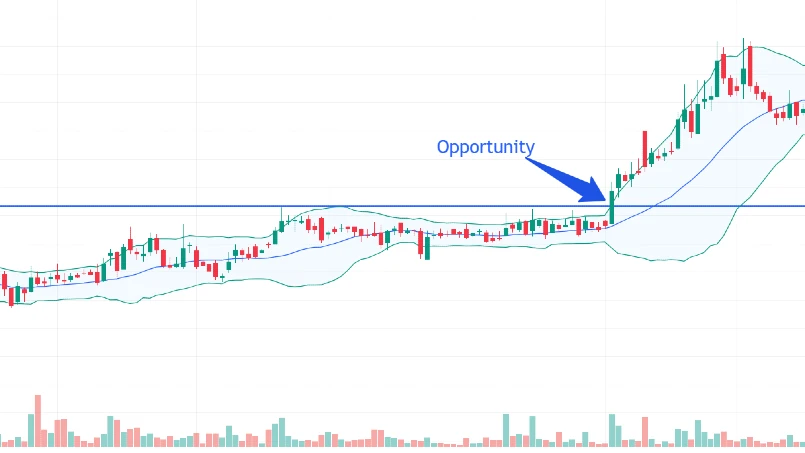
For several candles, the price of Redington Ltd is moving sideways in a tight range. When the Bollinger Bands tighten like this, it’s a clear sign of a squeeze coming. This tells us that volatility is low and a potential breakout could be near.

Step 2: The Breakout Candle Appears
A strong green candle breaks and closes above the upper Bollinger Band, with a noticeable increase in volume and RSI cross 60. This is a sign that buyers are taking control. This is your potential entry signal.

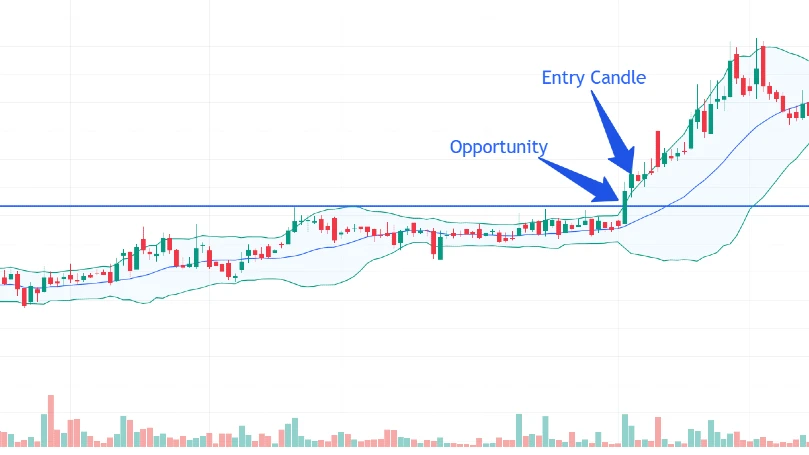
Step 3: Entry Point
The entry point will be the 2nd candle because the 2nd candle has confirmed the Bollinger Band (BB) Blast.

Step 4: Stop-Loss Placement
The best stop loss is the 20 SMA, which is the middle line of the Bollinger Band, but you’re right, then 5 SMA can also work as a stop loss, helping us protect our profit.

Step 5: Setting the Target
As long as the price does not close below the 5 SMA or 20 SMA—whichever you choose—we will continue to ride the profit.
This is a textbook example, but even in real markets, these setups are not rare. The key is to wait patiently for tight consolidation, confirm the breakout, and only enter when all conditions align.
Risk Management Tips
A trading strategy is only as good as your ability to manage risk. I’ve seen traders with excellent setups still lose money simply because they didn’t respect the rules of money management. So, before you even think about hitting “Buy” or “Sell,” make sure your risk management is locked in.
Here are some hard-earned lessons and tips that can protect your capital and increase your consistency:
1. Never Risk More Than 1–2% of Your Capital Per Trade
This is the golden rule. If you’ve got ₹10,000 in your trading account, keep your risk to ₹1,00–₹200 on any one trade. That way, even if you lose 3 or 4 trades in a row, your account survives — and you’re still in the game.
2. Use Stop-Losses Without Fail
Some traders treat stop-losses like optional safety nets. They’re not. They are essential. Use charts, not feelings, to decide where to put your stop-loss. Don’t widen your stop just because you “feel” the price might come back. If things don’t go as planned, just get out and move forward.
3. Keep a Consistent Risk-Reward Ratio
Only go for trades where the potential upside is twice as much as what you might lose. This means even if you win just 50% of your trades, you’ll still be profitable. A good trade is not just about winning — it’s about winning more when you’re right than you lose when you’re wrong.
4. Don’t Chase Missed Setups
If you miss an entry, let it go. Chasing after price leads to bad entries and emotional decisions. The market is full of opportunities — but you need a calm, repeatable process to take advantage of them.
5. Track Your Trades
This may sound boring, but tracking your trades in a journal can be a game-changer. Note down:
- Entry and exit points
- Reason for the trade
- Result (win/loss)
- What you learned
Over time, you’ll notice patterns that let you refine how you approach things.
You may also Like : Stock Market Success: Mindset and Knowledge 2025
Final Word on Risk
Swing trading is not about winning every trade — it’s about protecting your capital and letting your edge play out over time. Professional traders think in probabilities, not predictions. Manage risk like a pro, and you give your strategy the space it needs to succeed.
Common Mistakes to Avoid
Even with a solid strategy, many traders stumble on avoidable mistakes. If you’re aware of these pitfalls, you’ll save yourself a ton of time, money, and headaches.
1. Jumping In Without Confirmation
Just because the price touches or breaks a Bollinger Band doesn’t mean you should enter immediately. Look for confirmation — like strong price action, volume spikes, or supporting indicators. Otherwise, you risk falling into false breakouts.
2. Ignoring the Overall Market Trend
Bollinger Bands work best when they match the overall trend in the market. For example, taking long trades when the market is strongly bearish can lead to losses. Always check the higher timeframe trend before entering.
3. Trading During High Volatility Events Without Preparation
Major news, earnings, or geopolitical events can cause wild price swings. Trading during these times without a clear plan often leads to unpredictable outcomes. If you’re new, it’s better to avoid trading around these events.
4. Not Backtesting the Strategy
Jumping into live trading without testing the strategy on historical data is a recipe for disaster. Backtesting helps you understand how the setup performs under different conditions and builds your confidence.
5. Overtrading and Poor Trade Management
Taking too many trades, chasing losses, or ignoring your stop-loss rules can quickly drain your capital. Stick to your plan and only take high-quality setups.
6. Letting Emotions Rule Your Decisions
Fear and greed are what hold traders back from real success. Stick to your rules, and don’t let a losing streak or a big win affect your judgment. Avoiding these mistakes will help you stay on the right track and increase your chances of consistent success with Bollinger Bands swing trading.
Backtesting and Practice
Before risking real money, it’s crucial to test your Bollinger Bands swing trading strategy on historical data. Backtesting helps you understand how the strategy behaves in different market conditions and builds your confidence.
Why Backtest?
- Learn the Strengths and Weaknesses: You’ll see when the strategy works best and when it struggles.
- Avoid Emotional Mistakes: Having seen the numbers helps you stick to your plan, even during drawdowns.
Improve Timing and Execution: Practicing entries, exits, and stops sharpens your skills.
How to Backtest?
- Pick Your Market and Timeframe: Choose the stocks, indices, or forex pairs you want to trade on Daily charts.
- Go Back in Time: Scroll back in your charting software and apply Bollinger Bands. Look for squeezes and breakout setups as per your strategy.
- Record Your Trades: Note entry price, stop-loss, target, and outcome (win/loss).
- Analyze Your Results: Calculate your win rate, average profit/loss, and risk-reward ratios.
- Refine Your Rules: Adjust your entry criteria, stop placement, or target if needed.
Practice in a Demo Account
Once you’ve backtested, try paper trading or demo accounts before going live. This helps you:
- Experience real-time emotions without risking capital
- Test your trade management and discipline
- Adjust to market quirks that historical data may not show
Conclusion: Simplicity, Discipline, and Patience Win the Game
Swing trading with Bollinger Bands isn’t about chasing every move or predicting the future — it’s about stacking the odds in your favor using tested, repeatable setups. This strategy, built around the Bollinger Band squeeze and breakout, gives you a clear structure to work with. It’s simple, but not easy — and that’s what makes the difference.
You don’t need to be a market expert or spend 10 hours a day in front of charts. What really matters is being consistent, managing your risk, and sticking to your plan. In reality, most traders fail not due to a poor strategy, but because they don’t follow it consistently.
Backtest this setup. Practice on a demo account. Review your trades honestly. If you’re willing to do that work, you’ll naturally get better — trade by trade, chart by chart.
There are no shortcuts. But if you focus on mastering one setup, protect your capital, and trust the process, swing trading can absolutely work for you. The tools are here. The strategy is in your hands. Now it’s your move.
Frequently Asked Questions (FAQs)
Disclaimer: The information provided in this article is for educational purposes only and should not be considered as financial advice. Always conduct your own research or consult with a qualified financial advisor before making any investment decisions.
