Moving averages are not just lines on a chart; they’re essential tools that can turn your trading into a science. Whether you’re new to the markets or looking to refine your strategy, these 5 powerful moving average strategies can help you spot trends, avoid common pitfalls, and find high-probability entry points. Ready to elevate your trading game? Let’s dive in!
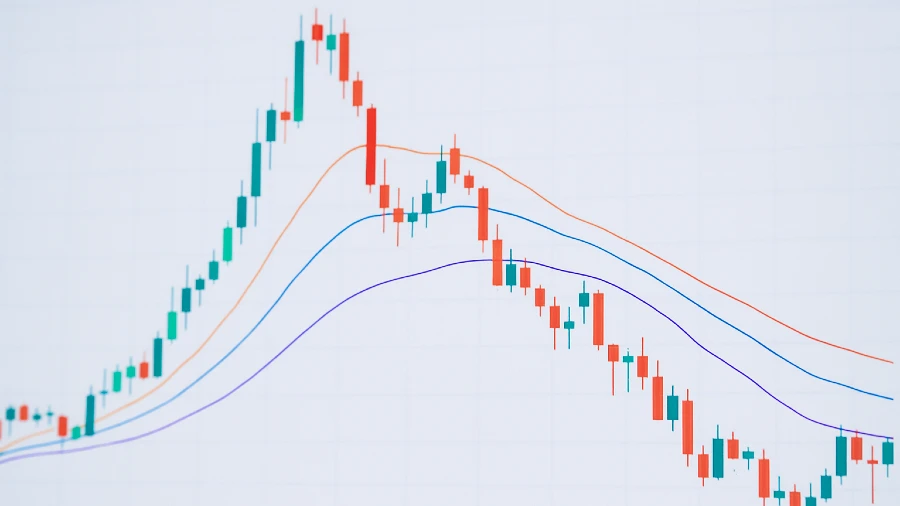
Moving averages are a core component of technical analysis, commonly relied upon by traders to spot trends and smooth out price data. They help traders identify trends, spot potential entry and exit points, and filter out noise in price action. But not all moving average strategies work equally well. In this guide, we’ll explore five moving average strategies that are simple, practical, and actually work for real traders.
Success can be achieved even by focusing on just one moving average as long as you practice consistently.
What Are Moving Averages and Why They Matter in Moving Average Strategies
Moving averages are indicators that smooth out price data to help identify the direction of the trend. There are two main types:
- Simple Moving Average (SMA): A simple calculation of the mean closing prices across a set time frame.
- Exponential Moving Average (EMA): It places greater emphasis on the most current prices, allowing it to react more quickly.
They are considered lagging indicators, meaning they follow price, but they’re incredibly useful when used with the right moving average strategies.
Strategy 1: The 50-200 EMA Crossover (Golden & Death Cross)
Best for: Swing and long-term traders
- Golden Cross: When the 50 EMA crosses above the 200 EMA, it signals a long-term uptrend. Consider entering long positions.
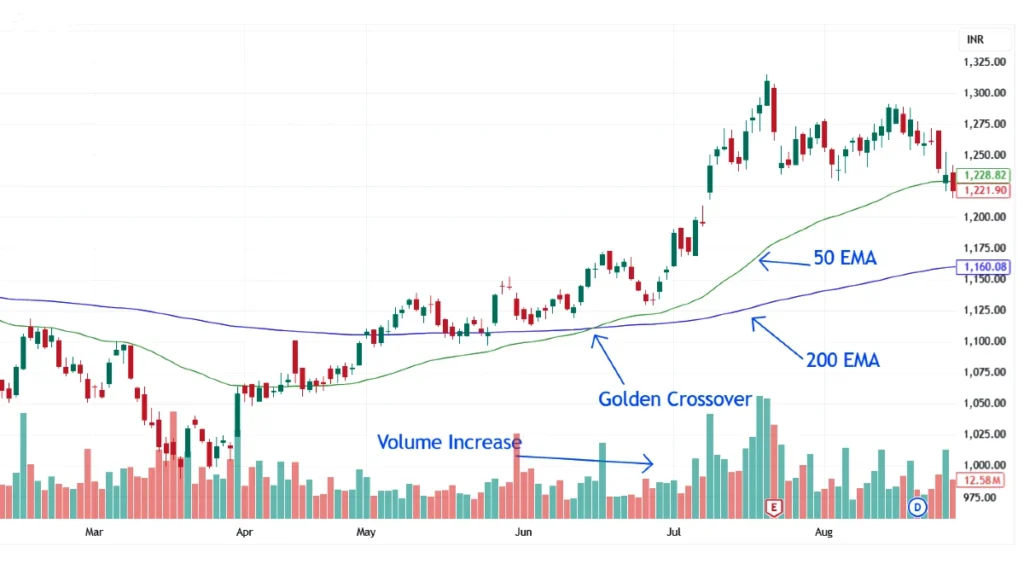
- Death Cross: When the 50 EMA crosses below the 200 EMA, it signals a long-term downtrend. Consider exiting longs or entering shorts.
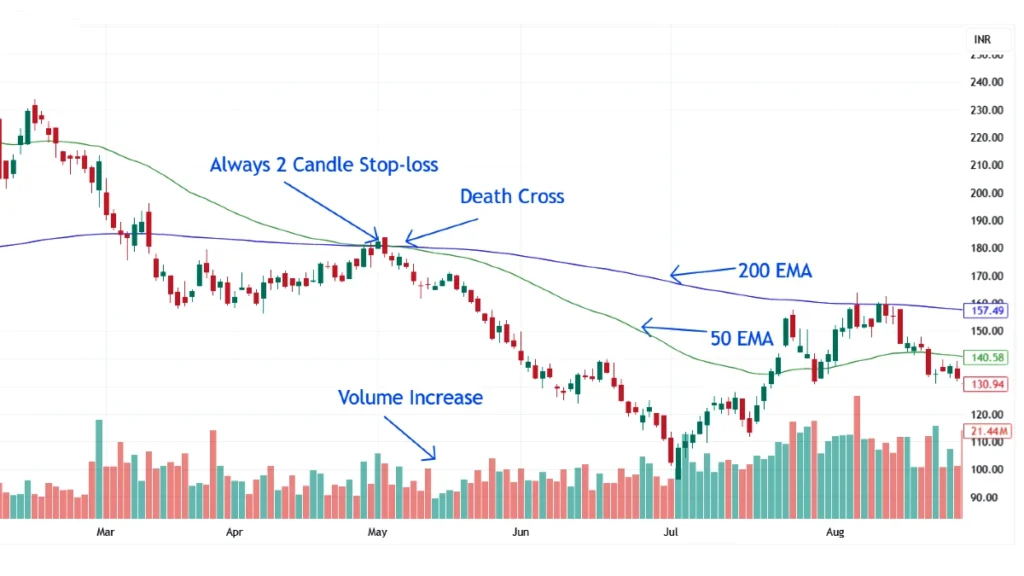
Bonus Tip: Add volume analysis for confirmation. A golden cross with rising volume is a strong bullish sign.
Strategy 2: 9 & 21 EMA Pullback Strategy
Best for: Intraday and swing traders
This strategy uses two fast EMAs — 9 and 21.
- Buy Setup: Price is above both EMAs. Wait for a pullback to the 21 EMA and a bullish candlestick (like a pin bar, engulfing and Super Candle) to enter long.
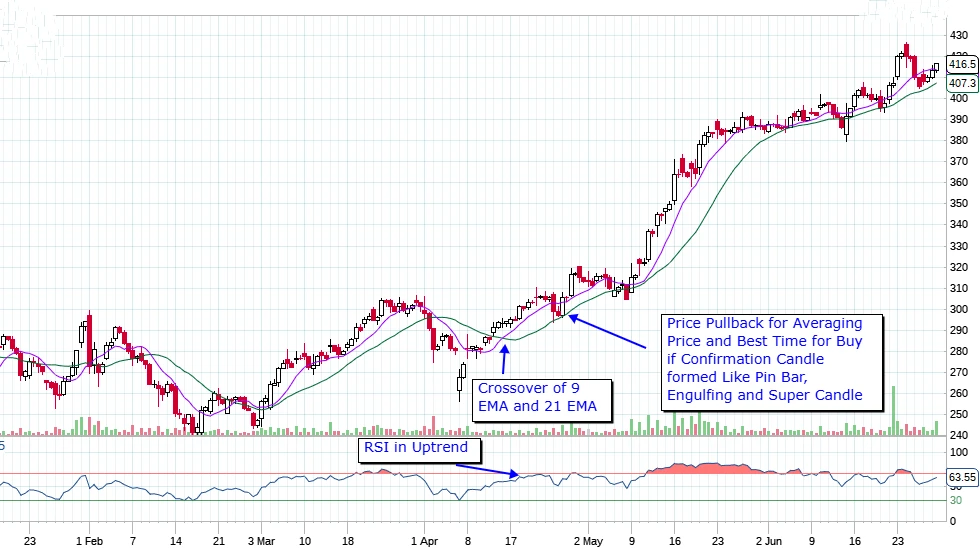
- Sell Setup: Price is below both EMAs. Wait for a pullback to the 21 EMA and a bearish candle to go short.
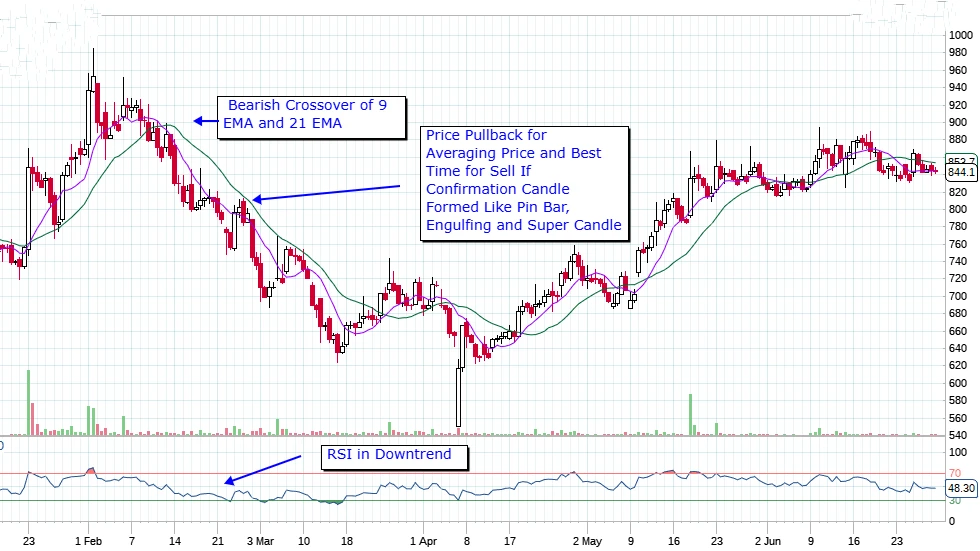
Pro Tip: Combine this with RSI to filter trades.
You may also Like : RSI Trading Strategy Explained: From Basics to Pro
Strategy 3: Moving Averages as Dynamic Support and Resistance
Best for: Trend-following traders
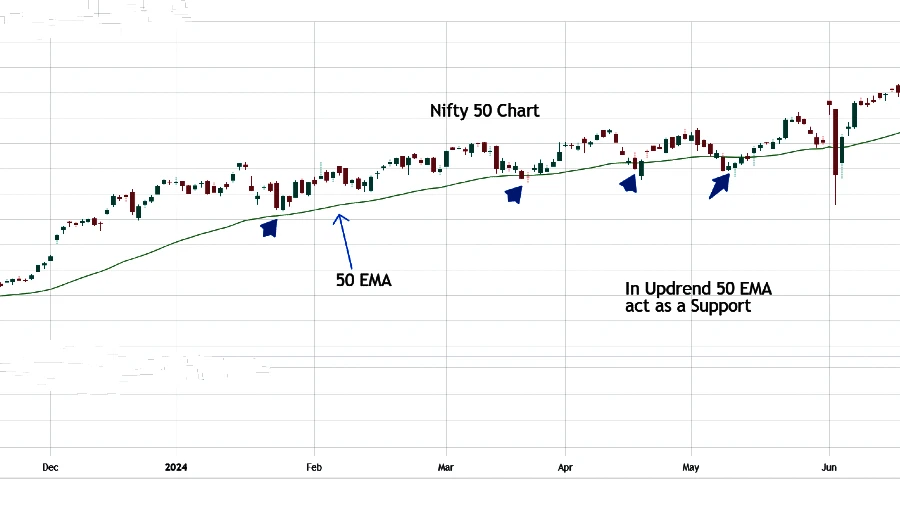
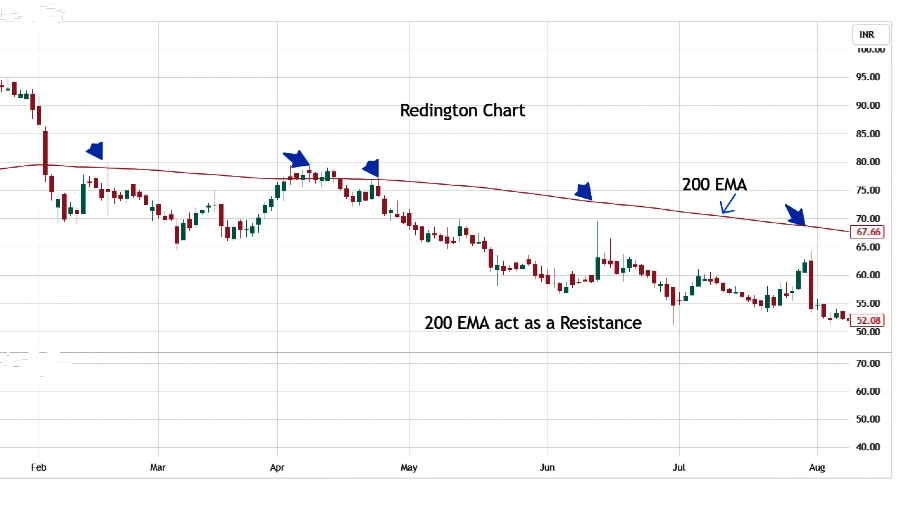
MAs, especially the 50 EMA and 200 SMA, often act as dynamic support or resistance:
- In an uptrend, price may bounce off the 50 EMA multiple times.
- During a downtrend, the 200 SMA can act as a strong resistance zone, limiting upward price movement.
Example: A bullish engulfing candle near the 50 EMA on a pullback is often a high-probability setup.
Strategy 4: Triple Moving Average (TMA) Strategy
Best for: Trend confirmation and filtering
Use three MAs:
- Short-term: 10 EMA
- Medium-term: 20 EMA
- Long-term: 50 EMA
Buy Signal: Buy Signal: When the EMAs are stacked in a bullish order (10 above 20, 20 above 50) and the price retraces to the 20 EMA for a potential bounce.
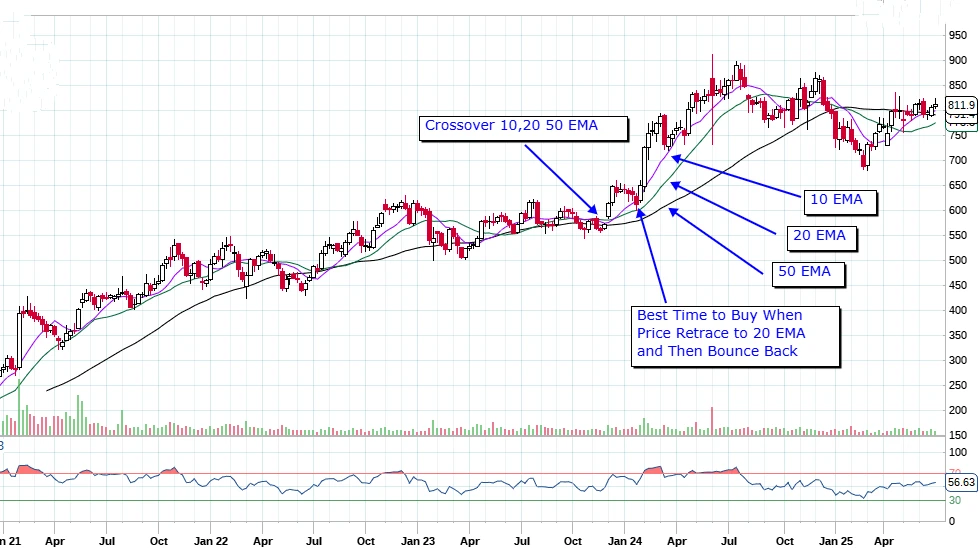
This pattern is more effective when all three EMAs are flat, and then a crossover occurs with the 10 EMA moving above the 20 EMA and 20 EMA moving above the 50 EMA that indicates a strong breakout.
Sell Signal: When the order is reversed.
This strategy filters out market noise, making it easier to identify strong, prevailing trends.
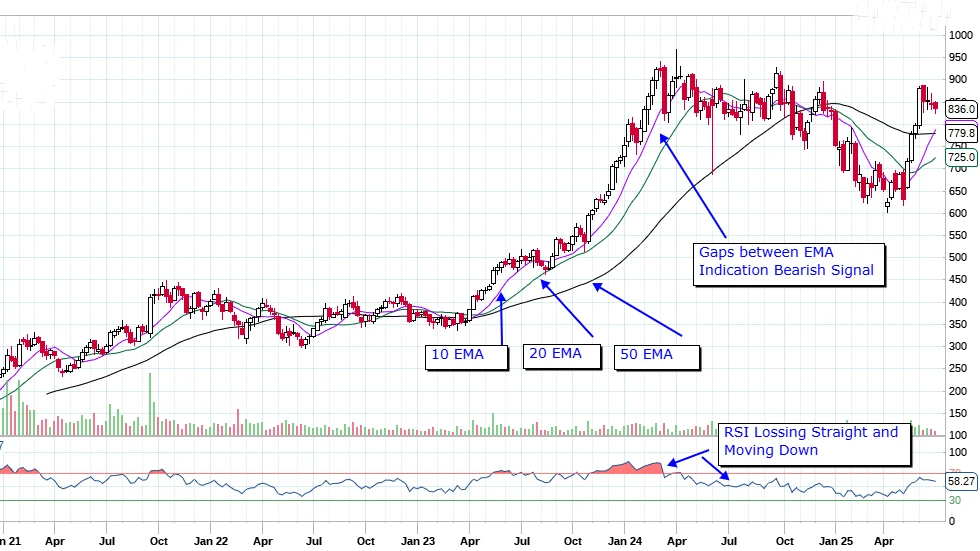
In the Bearish Triple Moving Average strategy, whenever a gap forms between the EMAs during a bullish trend, it indicates that the price may start to fall. This can be confirmed with support from the RSI.
You may also Like : Bollinger Bands and RSI Strategy |The Key to Trading Success
Strategy 5: Moving Average Channel Breakout
Best for: Breakout traders
To create a channel using two EMAs, you can plot the 20 EMA on the high and low prices. This would involve:
- 20 EMA High: Calculate the 20-period EMA based on the highest price of each candle (e.g., the high of the day).
- 20 EMA Low: Calculate the 20-period EMA based on the lowest price of each candle (e.g., the low of the day).
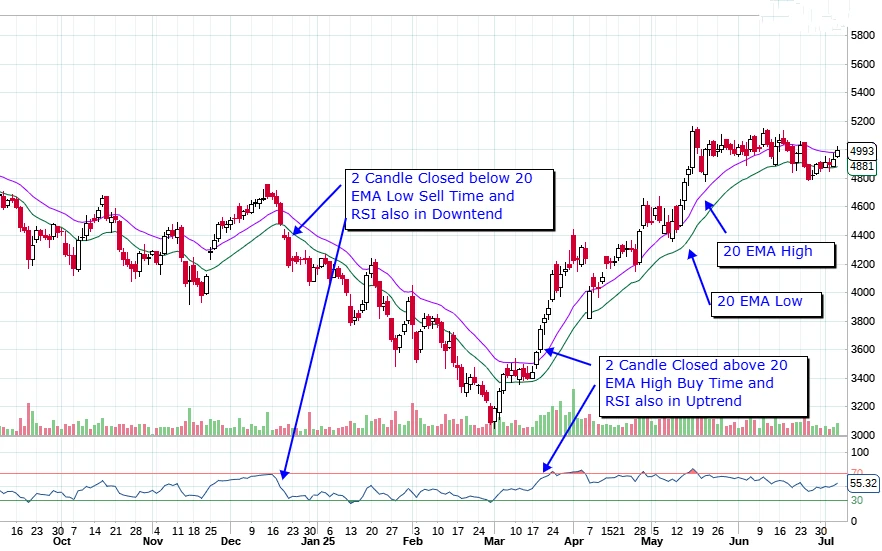
The channel is created by drawing a boundary between the 20 EMA High (upper limit) and the 20 EMA Low (lower limit). This setup helps visualize price movement within a range, allowing traders to spot breakouts or reversals when price approaches or moves outside the channel.
Note: Works best with RSI confirmation.
Tips to Maximize Success
- Always backtest before trading live.
- Combine moving averages with other tools like the RSI, volume, and price action for a more comprehensive analysis
- Avoid sideways/choppy markets.
- Don’t chase; wait for confirmation.
Common Mistakes to Avoid
- Overusing crossovers: They lag in strong trends.
- Ignoring trend context: Don’t use MA blindly in sideways markets.
- Wrong timeframes: Use MA settings suitable to your trading style.
- Too many indicators: Keep your chart clean and focused.
Frequently Asked Questions (FAQs)
Conclusion
Moving averages aren’t just lines on a chart — when used correctly, they are powerful tools for identifying trends, entries, and exits. These five moving average strategies are beginner-friendly yet effective even for experienced traders. Pick one that fits your trading style, test it thoroughly, and refine it over time.
Whether you’re day trading or investing longer term, mastering moving averages can give you a consistent edge in the markets.
Disclaimer: The information provided in this article is for educational purposes only and should not be considered as financial advice. Always conduct your own research or consult with a qualified financial advisor before making any investment decisions.
