The more indicators you stack on your chart, the more confusing trading becomes. It doesn’t have to be that way. What if you could trade just by watching the price—no noise, no distractions? Just clean charts, candlesticks, and your understanding of the market. That’s the power of a real price action strategy—simple, sharp, and grounded in what the market is actually doing.
1. What Is Price Action Strategy?
Truthfully, trading can get overwhelming with dozens of indicators, signals, and opinions. But what if you could ditch all the noise and focus on the price? That is exactly what a price action strategy is all about. Cutting through the noise and focusing purely on price.
So, what is price action? Simply put, price action is how the price moves on a chart—nothing more, nothing less. It is about reading the story that each candle tells, watching how buyers and sellers react at different levels, and making decisions based on that.
This movement forms the foundation of the price action strategy many traders rely on.
How is it different from indicator-based trading? Most indicators lag—they tell you what already happened. Price action puts you right there at the moment. No distractions. Just clean, raw data. Some traders even call it naked trading because it strips the chart of everything but price. That’s why traders prefer building a strategy based on what the price is doing now—not what an indicator says happened earlier.
Why do serious traders love it? Because once you get the hang of it, it gives you clarity. You start seeing what the big players are doing, where money is flowing, and how the market breathes. This clarity is what makes price action more than just a style—it’s a strategy that helps traders think in sync with the market.
2. Core Principle of Price Action Strategy
Price tells the whole story — that is the foundation. If something major is happening (good or bad), it reflects in the price first.
Demand and supply zones are where the real battle happens. Price tends to react at these levels—either bouncing off or breaking through.
And here is the kicker: you do not need fancy indicators. Just a clean chart and a trained eye. That is the essence of a good price action strategy.
3. Tools Needed for Price Action Trading
Keep it simple. Open your charting platform and turn off everything—no RSI, no MACD. Use candlestick charts because they show a lot more than lines.
Choose your timeframe wisely:
- Intraday traders might use 1H chart and Daily Chart.
- Swing traders usually go for Daily and Weekly Chart.
This is where trendline trading begins. Drawing trendlines on clean charts gives you a great edge.
Best Platform & Tools for Price Action Traders
To make the most of your price action journey, here are some must-use platforms:
- TradingView: Perfect for clean charting, drawing tools and replay mode for backtesting.
- Zerodha: Widely Used by retail traders for live execution and chart analysis.
- Investing.com: great for keeping an eye on economic events that’s influence price.
These tools help you implement your price action strategy more effectively by giving you a clear, distraction-free view of the market
4. Key Candlestick Patterns to Know
Single candle patterns:
- Hammer: Buyers are pushing back after a fall.
- Doji: Market’s confused—wait for confirmation.
- Shooting Star: Sellers are taking over at the top.
Multi-candle patterns:
- Engulfing (Bullish/Bearish): Big reversal energy.
- Morning Star: Signs of a fresh uptrend.
- Evening Star: Time to exit long trades.
These are your early price action signals. Don’t memorize—understand the logic behind them.
5. Support and Resistance Made Simple
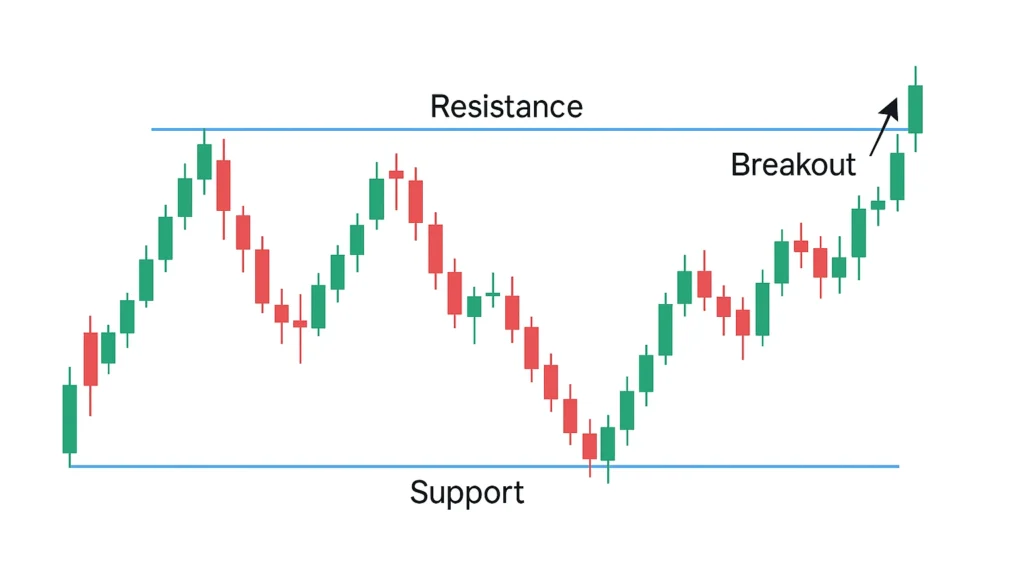
Support is where buyers show up. Resistance is where sellers fight back.
How to find them: Look left on your chart. Where did the price pause, reverse, or bounce before? These are your key support and resistance levels.
Once you mark these zones, watch how the price behaves around them. A real breakout has momentum. A fake breakout? It’ll reverse fast.
This is part of reading market structure, where price has memory.
6. Spotting the Trend (Without Guessing)
Uptrend = Higher Highs + Higher Lows Downtrend = Lower Highs + Lower Lows
Draw simple trendlines connecting the swings. If it respects the line over and over, it’s a real trend.
Break of trendline = Watch closely. Something’s changing. This is how smart traders adapt using trendline trading.
7. Price Action Patterns That Work
Here are a few common and reliable price action patterns:
- Flags & Pennants: Quick pauses before the trend continues.
- Triangles: Price getting squeezed before a breakout.
- Double Tops/Bottoms: Major reversal signs.
- Head & Shoulders: Reversal classic. Use it well.
The magic is in waiting for confirmation. Don’t jump in early.
8. Entries, Exits & Stop-Losses
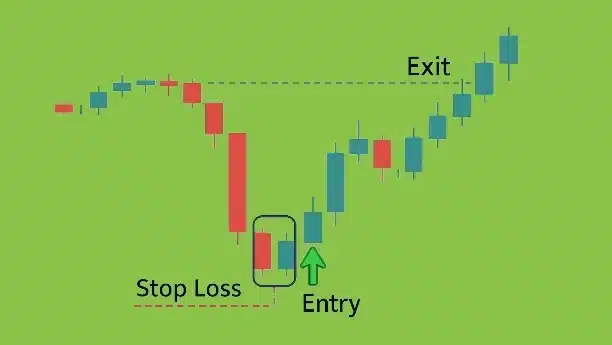
Entries: Don’t chase. Wait for the price to reach your level and give you a price action signal (a wick rejection, engulfing candle, etc.).
Stop-loss: Place it just beyond the structure, below recent lows or above highs. Keep your risk tight. This is where risk management in trading becomes crucial.
Targets: Use previous key levels or aim for a 1:2 or 1:3 risk-reward. Always trade with a solid price action strategy.
9. Don’t Fall into These Traps
- Jumping into trades without a setup
- Ignoring the bigger trend
- Letting emotions force a trade
- Giving up on price action because of one bad week
Also, be mindful of your trading psychology. Fear, greed, and doubt can ruin a perfect setup.
Consistency comes from discipline, not excitement.
10. Practice & Backtest Smartly
Before risking real capital, make sure to test your price action strategy on historical charts.
Don’t just read—practice.
Pull up a blank chart. Go back in time. Play bar-by-bar. Try spotting price action patterns. Journal your observations.
Once you’re winning more than losing on paper, slowly move to real trades. This habit shapes your understanding of market structure.
How Long Does It Take to Master Price Action?
There’s no shortcut. Most traders need at least 6–12 months of regular chart observation to get truly comfortable.
- Focus on one or two patterns at first
- Observe how they behave in different timeframes and market conditions
- Avoid jumping systems—give price action your full attention
Over time, your eyes will start catching signals almost automatically. That’s when real confidence begins.
11. Final Thoughts
Price action isn’t a magic bullet. But it’s one of the cleanest and most powerful ways to understand the market.
If you want to truly connect with how the market moves—without the clutter—this is where you start.
Learn it. Respect it. Stick with it.
Because once you see how much information price alone gives you, you’ll never want to go back to messy charts again. Stick to your price action strategy, refine it with experience, and let price be your guide—not indicators.
Disclaimer: The information provided in this article is for educational purposes only and should not be considered as financial advice. Always conduct your own research or consult with a qualified financial advisor before making any investment decisions.