
Have you ever looked at a stock chart and noticed a candle with a small body and a long lower wick? It may look unusual, but it can reveal an important change in how buyers and sellers are behaving.
This formation is known as the hammer candlestick pattern. In technical analysis, it is commonly associated with a possible bullish reversal after a price decline. However, spotting a hammer does not automatically mean that the price will rise.
Understanding where the pattern appears, how it forms, and what happens afterward can help you interpret price charts more carefully.
In this guide, you will learn what a hammer candlestick means, how to identify it, how to understand practical examples, and how it differs from similar candlestick patterns.
- What Is a Hammer Candlestick Pattern?
- How to Identify a Hammer Candlestick
- 3. Little or No Upper Shadow
- 4. A Previous Downtrend
- How Does a Hammer Candlestick Form?
- Step 1: Sellers push the price lower.
- Step 2: Buyers respond at lower prices.
- Step 3: The price recovers before the close.
- Step 4: The pattern attracts attention.
- Hammer Candlestick Pattern with Examples
- Example 2: A Green Hammer
- Example 3: A Hammer Followed by a Stronger Candle
- Example 4: A Hammer That Fails
- What does this tell you?
- Hammer vs. Hanging Man
- Hammer vs. Inverted Hammer
- Common Mistakes to Avoid
- Advantages and Limitations of the Hammer Pattern
- How Beginners Can Practise Identifying Hammer Candlestick
- Frequently Asked Questions
- Conclusion
What Is a Hammer Candlestick Pattern?
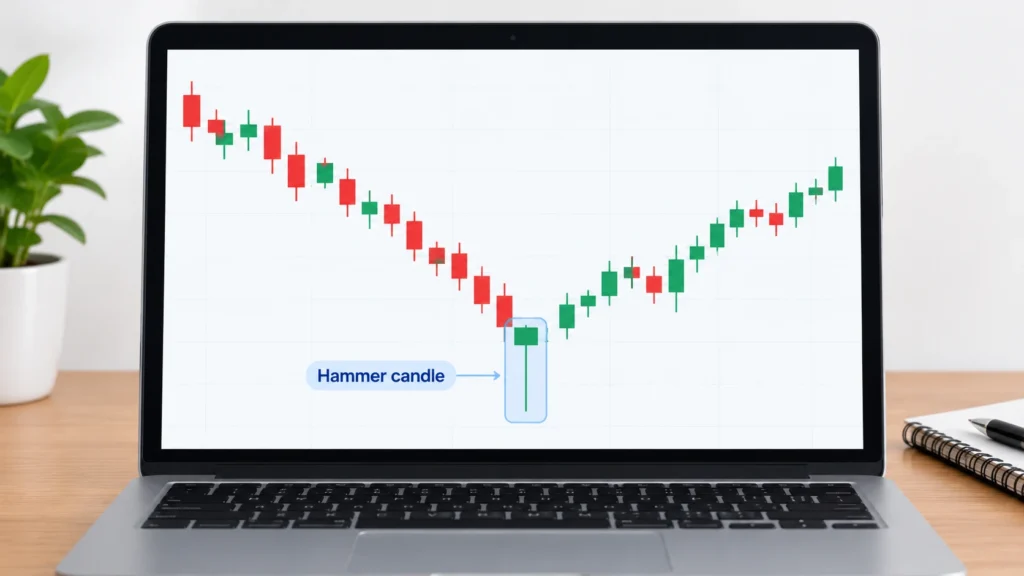
A hammer candlestick pattern is a single candle formation that typically appears after a downtrend. It has a small real body near the top of the candle’s range and a long lower shadow, also called a lower wick.
The pattern suggests that sellers pushed the price down during a trading session, but buyers later helped the price recover toward the opening level before the session ended.
This recovery can indicate that selling pressure is weakening or that buyers are becoming more active. However, the pattern alone cannot confirm that a downward trend has ended.
In simple words: A hammer forms when the price falls significantly during a session but recovers before the session closes, leaving a long lower wick.
For example, imagine a stock has been falling for several days. During one session, its price drops sharply but then recovers most of the decline. If the candle closes near the top of its range with a small body and a long lower wick, it may form a hammer. The surrounding price movement is important. A similar-looking candle in the middle of a sideways market does not carry the same interpretation.
How to Identify a Hammer Candlestick
To recognize a hammer correctly, look at its shape and the price movement that came before it.
1. Small Real Body Near the Top
The real body represents the difference between the opening and closing prices. In a hammer, this body is relatively small and sits near the upper end of the candle’s overall range.
The body can be green or red. A green body means the closing price is above the opening price, while a red body means the closing price is below the opening price.
Both colors can form a hammer. The candle’s structure and its location after a decline matter more than color alone.
2. Long Lower Shadow
The lower shadow shows how far the price moved below the lower edge of the real body.
A common guideline is that the lower shadow should be at least twice the length of the real body. Some traders look for a longer shadow, but this is a practical identification guideline rather than a universal rule.
A long lower wick shows that the market traded at substantially lower prices before recovering.
3. Little or No Upper Shadow
A traditional hammer usually has a very short upper shadow or none at all.
This means the high price is close to the top of the real body. Combined with the long lower shadow, it gives the candle its familiar hammer-like appearance.
4. A Previous Downtrend
This is one of the most important conditions.
A hammer is interpreted as a potential bullish reversal pattern when it appears after a price decline. Without a preceding downtrend, the same candle shape may not have the same meaning.
The pattern should be identified in context rather than by appearance alone.
How Does a Hammer Candlestick Form?
The hammer’s formation can be understood by following the price movement during a trading session.
Step 1: Sellers push the price lower.
The market has already been declining, and selling pressure continues. During the session, the price falls below its opening level.
Step 2: Buyers respond at lower prices.
After the decline, buying activity helps the price recover. The recovery may reflect renewed demand, short covering, or other market activity. The candle alone cannot tell you which participants caused the move.
Step 3: The price recovers before the close.
The market closes much closer to the top of its trading range than its low. This leaves a long lower shadow and a relatively small real body.
Step 4: The pattern attracts attention.
Because the price has recovered from its low, chart readers may interpret the candle as a sign that lower prices were rejected during that session.
The key point is that a hammer shows a recovery within one candle. It does not prove that buyers will remain in control during the next session.
Hammer Candlestick Pattern with Examples
The following examples use hypothetical prices to explain how the pattern works. They are illustrations, not actual historical market events or trading recommendations.
Example 1: A Hammer After a Downtrend
Imagine a stock has declined from ₹250 to ₹220 over several trading sessions.
On the next day:
- Opening price: ₹220
- Highest price: ₹222
- Lowest price: ₹208
- Closing price: ₹219
The price falls from ₹220 to ₹208 during the session but later recovers to ₹219.
The real body extends from ₹219 to ₹220, giving it a height of ₹1. The lower shadow extends from ₹208 to ₹219, measuring ₹11.
The lower shadow is therefore much longer than the real body. The candle also has a small upper shadow and appears after a decline.
These features are consistent with a hammer candlestick.
What does it suggest?
The price recovery indicates that buyers responded after the stock reached ₹208. This may be an early sign of a possible bullish reversal, but further price action is needed to assess whether the recovery continues.
Example 2: A Green Hammer
Suppose another stock has been falling from ₹180 to ₹160.
During one session, the following prices are recorded:
- Opening price: ₹160
- Highest price: ₹162
- Lowest price: ₹151
- Closing price: ₹161
The stock falls as low as ₹151 but closes at ₹161, slightly above its opening price.
The small green body and long lower wick create a hammer-like shape.
What can you learn from this example?
The green body shows that the stock closed above its opening price. The long lower wick shows that it recovered substantially from the session’s low.
Some chart readers may view this as a more encouraging sign than a red hammer with a similar structure. Nevertheless, the candle’s color does not guarantee a reversal. The prior trend and subsequent price action remain important.
Example 3: A Hammer Followed by a Stronger Candle
Consider a stock that has declined from ₹500 to ₹460.
A hammer forms with these hypothetical prices:
- Opening price: ₹462
- Highest price: ₹464
- Lowest price: ₹448
- Closing price: ₹461
On the following day, the stock opens at ₹463 and closes at ₹474, forming a bullish candle that closes above the hammer’s high of ₹464.
How can this be interpreted?
The hammer suggests that the market recovered from lower prices. The following candle provides additional evidence of buying strength because it closes above the hammer’s high.
This is one commonly used method of confirmation. It can make the bullish interpretation more convincing, but it still does not guarantee that the price will continue rising.
A careful chart reader would also consider the broader trend, nearby support and resistance, trading volume, and the possibility of a failed reversal.
Example 4: A Hammer That Fails
Imagine a stock falls from ₹320 to ₹290 and then forms a hammer near ₹290.
The next session begins with a small recovery, but selling pressure returns. The price falls below the hammer’s low of ₹282 and continues declining.
What does this tell you?
The expected reversal did not develop. The market moved below the level where the hammer had formed, showing that the earlier recovery was not enough to establish lasting upward momentum.
This example highlights an important lesson: a hammer is a possible reversal signal, not a prediction that must come true. Studying failed patterns is just as important as studying successful looking examples.
How to Interpret a Hammer Candlestick
Once you identify a possible hammer, the next step is to examine the surrounding chart.
Check the Previous Trend
First, determine whether the price was actually declining before the hammer formed.
Look for a clear downward movement rather than assuming that every candle with a long lower wick signals a reversal.
Observe Support Levels
Support is an area where buying interest has previously helped slow or stop a price decline. A hammer forming near a well-observed support area may attract more attention than one forming in the middle of an unstructured price range. However, support can fail, and it should not be treated as an absolute price floor.
Look for Confirmation
Some traders wait for the next candle to close above the hammer’s high before considering the bullish interpretation more convincing.
Others study additional price action or technical indicators. Different approaches use different confirmation rules, and no single method eliminates uncertainty.
Consider Trading Volume
Volume measures how much of an asset was traded during a given period.
A hammer accompanied by relatively high volume may indicate greater participation during the price recovery. However, volume must be interpreted in context, and higher volume does not automatically confirm a reversal.
Review the Broader Market
A hammer on an individual stock may appear while its sector or the broader market remains weak. Understanding the larger market environment can help you avoid interpreting one candle in isolation.
Hammer vs. Hanging Man
The hammer and hanging man have a similar candle shape, but their interpretations depend on the preceding trend.
| Feature | Hammer | Hanging Man |
| Previous trend | Downtrend | Uptrend |
| Candle shape | Small body near the top, long lower wick | Small body near the top, long lower wick |
| Common interpretation | Potential bullish reversal | Potential bearish reversal |
| What to examine next | Evidence of upward follow-through | Evidence of downward follow-through |
The most important difference is the context in which the candle appears.
A hammer forms after a decline and may warn that selling pressure is weakening. A hanging man forms after an advance and may warn that selling pressure is emerging.
Neither pattern confirms a reversal by itself.
Hammer vs. Inverted Hammer
An inverted hammer also appears after a decline, but its shadow is on the opposite side of the body.
| Feature | Hammer | Inverted Hammer |
| Long shadow | Lower shadow | Upper shadow |
| Real body | Near the top of the range | Near the bottom of the range |
| Potential interpretation | Bullish reversal | Bullish reversal |
| Key consideration | Recovery from lower prices | An upward price attempt that does not hold its high |
A hammer shows that the price recovered after falling. An inverted hammer shows that the price moved higher during the session but retreated before the close.
Both patterns can indicate a possible change in sentiment, but both require context and subsequent price confirmation.
Common Mistakes to Avoid
1. Ignoring the Previous Downtrend
A candle’s shape is not enough. If you do not examine the preceding price movement, you may label an ordinary candle as a hammer.
2. Treating Every Long Lower Wick as a Hammer
A long lower wick is only one feature. The body should be relatively small and near the upper end of the candle’s range, and the overall structure should fit the pattern.
3. Assuming a Green Hammer Is Always Stronger
A green hammer closes above its opening price, but a red hammer can also show a substantial recovery from the low. Color alone is not a reliable measure of future direction.
4. Entering Without Examining Confirmation
The hammer describes price action during a completed candle. It does not tell you what will happen next.
Studying the following candles can help you distinguish a developing reversal from a brief recovery.
5. Forgetting the Larger Market Context
A hammer can fail during a strong downtrend or when important support levels break. Consider the broader chart instead of relying on a single formation.
6. Believing the Pattern Guarantees Profit
No candlestick pattern guarantees a successful outcome. Market conditions change, and prices can move against the interpretation suggested by a hammer.
Advantages and Limitations of the Hammer Pattern
Advantages
- Easy to recognize: Its small body and long lower shadow make it relatively straightforward to identify.
- Shows price rejection: It records a session in which the price recovered substantially from its low.
- Encourages contextual analysis: It gives beginners a reason to study trends, support levels, and subsequent candles.
- Can be combined with other observations: Price structure and volume may provide additional context.
Limitations
- False signals occur: The price may continue falling after a hammer appears.
- Interpretation depends on context: The same shape does not have the same meaning in every market situation.
- Confirmation takes time: Waiting for additional price action may mean that part of a potential recovery has already occurred.
- Results vary: A pattern’s usefulness can differ across assets, timeframes, market conditions, and identification rules.
The hammer is best understood as one piece of information within a broader chart analysis, not as a standalone forecasting method.
How Beginners Can Practise Identifying Hammer Candlestick
You can build familiarity with the pattern by studying historical charts without risking money.
- Choose a chart: Start with a stock or index chart that displays clear candlesticks.
- Find a decline: Look for an identifiable downward movement.
- Inspect individual candles: Search for a small body near the top of the range and a long lower shadow.
- Compare the shadow and body: Use the two-to-one lower-shadow guideline as an initial reference.
- Study the next candles: Record whether the price moved above the hammer’s high, remained sideways, or fell below its low.
- Record unsuccessful examples: Include failed patterns rather than remembering only those followed by price increases.
With practice, you can learn to distinguish the hammer from other candle shapes and understand why the surrounding price movement matters.
Frequently Asked Questions
Conclusion
The hammer candlestick pattern helps you study how a market responds after prices fall. Its small real body, long lower shadow, and position after a downtrend are the main features to recognize.
However, identifying the pattern is only the first step. You also need to examine the previous trend, nearby price levels, subsequent candles, and the broader market context. By studying both successful looking and failed examples, you can develop a clearer understanding of candlestick behaviour without assuming that any single pattern can predict the future with certainty.